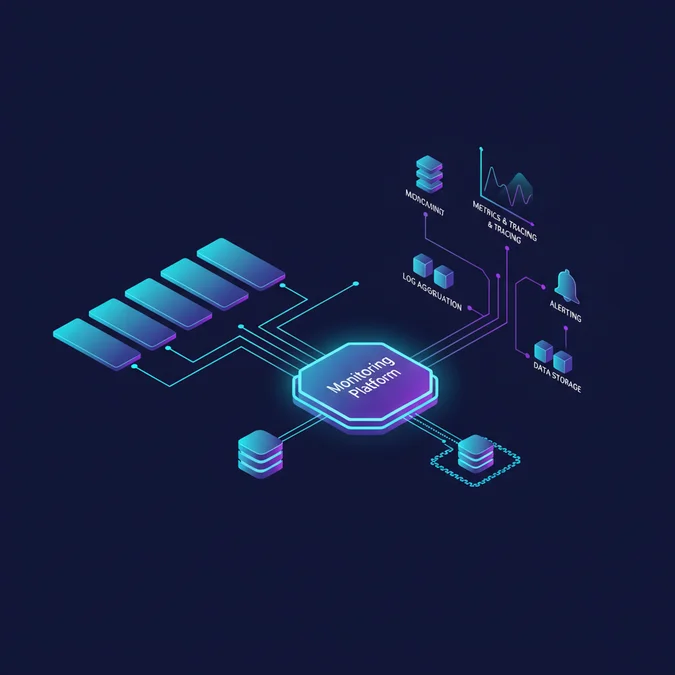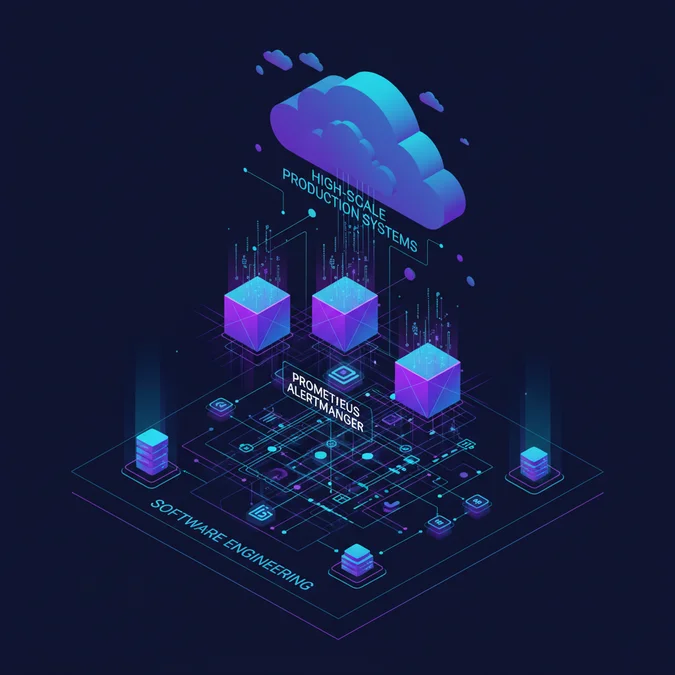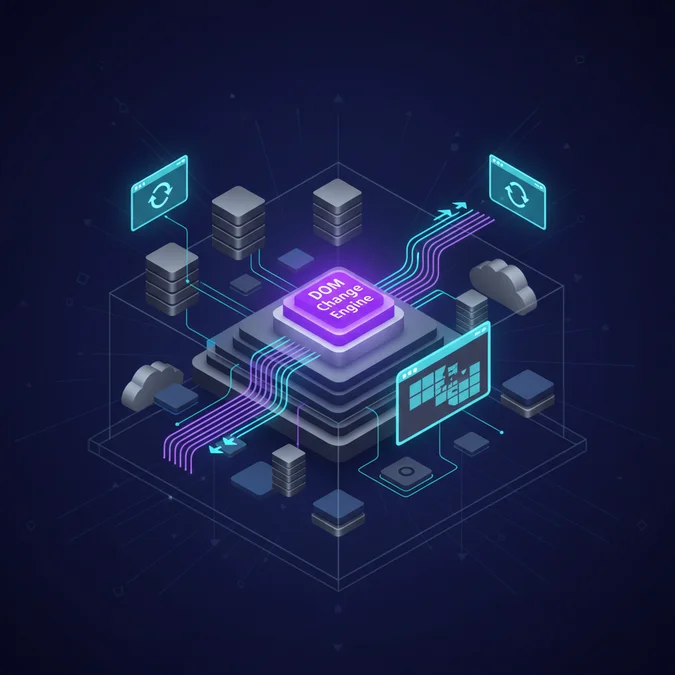

A production web update checker parses dynamic DOM trees, extracts scoped structural selectors, isolates deterministic content from transient runtime noise, and emits actionable telemetry over enterprise notification channels. When critical competitive pricing portals, regulatory bulletins, or upstream vendor status dashboards modify layouts without publishing structured RSS or API endpoints, headless DOM diffing bridges the observability gap.
Standard HTTP status probes fail silently against modern dynamic single-page applications. An endpoint returning a 200 OK status code can present an empty React mounting node, a Cloudflare Turnstile challenge, or an unrendered error boundary. Relying purely on basic ping checks blinds platform engineering teams to silent functional regressions and critical external payload drifts.
This architecture guide breaks down the mechanics of content verification engines. We examine the transition from basic HTTP polling to headless browser drivers, write concrete Playwright scrapers that strip volatile DOM elements, establish self-hosted Docker clusters, and export synthetic state metrics straight into Prometheus and Alertmanager pipelines.
Taxonomy of Modern Web Monitoring and Change Detection Engines
Automated tracking across public and private endpoints falls into three operational tiers: transport verification, DOM string differential parsing, and computer vision pixel validation. Implementing effective web monitoring requires selecting the right inspection depth to prevent false positives and unnecessary compute overhead.
Traditional network-layer checks verify whether an endpoint is live by examining transport parameters, TLS certificate validity, and raw HTTP response headers. This technique, commonly known as monitoring site web availability, operates at low CPU and memory budgets. However, a lightweight site monitor cannot evaluate client-side JavaScript rendering, state hydration, or dynamic content loading inside client views.
+-----------------------------------------------------------------------------------+
| Layer 1: Network Transport Layer (cURL / HTTP GET) |
| Checks: Status Codes (200, 301, 500), TLS Validity, Latency. Fast, no DOM. |
+-----------------------------------------+-----------------------------------------+
 |
 v
+-----------------------------------------------------------------------------------+
| Layer 2: Headless DOM Extraction (Playwright / Chromium) |
| Executes dynamic JavaScript, handles Shadow DOM, strips volatile layout noise. |
+-----------------------------------------+-----------------------------------------+
 |
 v
+-----------------------------------------------------------------------------------+
| Layer 3: Telemetry & Alerting Pipeline (Prometheus / Alertmanager) |
| Emits state gauge metrics, computes diff hashes, triggers notification routing. |
+-----------------------------------------------------------------------------------+
Comprehensive change monitoring shifts the evaluation workload into headless browser rendering engines like Chromium or WebKit. A dedicated website change detector loads the page context, executes client-side hydration, unwraps dynamic shadow roots, and converts target nodes into normalized text trees. In high-density environments, a continuous web page tracker discards stylistic markup, evaluates structural variations, and emits deterministic events based on semantic modifications rather than random DOM churn.
Production change detection fails most often during client-side hydration. If a scraper parses static HTML before the single-page application finishes mounting data attributes, it records structural drift that does not exist in production.
Before standardizing on a tracking pattern, run through this structural readiness checklist:
- Rendering Profile: Does the target page deliver plain server-rendered HTML or execute complex single-page client bundles requiring Chromium runtime environments?
- Volatile Artifacts: Are rotating banner elements, session UUIDs, anti-forgery tokens, or dynamic clock timestamps present inside the primary extraction target?
- Data Ingress Footprint: Does the network policy permit external SaaS crawler IPs, or must internal intranet documents be queried through a containerized engine running on a private VPC?
- Downstream Telemetry: Will alerts flow into basic webhooks, or must operational metrics expose continuous OpenMetrics scraping endpoints for enterprise visualization?
Comparative Matrix: Headless Scrapers, Cloud Services, and Server Daemon Tools
Engineering teams evaluating website change monitoring tools face trade-offs across privacy compliance, operational maintenance, and infrastructure resource consumption. Choosing a managed vendor or an internal website monitoring application dictates whether internal intranet endpoints remain secure and whether scrapers can be integrated into custom observability stacks.
While finding the best website monitoring service often leads teams toward off-the-shelf cloud SaaS solutions, these platforms restrict custom browser automation routines, rate-limit polling intervals, and expose private DOM data to third-party databases. Conversely, managing dedicated web monitoring programs inside bare-metal or Kubernetes environments requires allocating CPU cores, memory limits, and proxy rotation infrastructure.
| Deployment Category | Average Latency | Memory Footprint | Private Network Access | Prometheus Exporter Support | Primary Failure Mode |
|---|---|---|---|---|---|
| Cloud SaaS Monitors | 50ms – 200ms | Zero Local RAM | Requires Ingress Tunnel | Rare / Webhook Only | Anti-bot Captchas & Paywalls |
| Browser Extension Scrapers | 1000ms – 3000ms | High (Host Browser) | Full Local Access | None | Host Sleep & Memory Leaks |
| Self-Hosted Daemons (changedetection.io) | 250ms – 800ms | ~250MB per Worker | Native VPC Integration | Native OpenMetrics Exporter | Headless Browser Zombie PIDs |
| Custom Headless CLI Scrapers | 300ms – 1200ms | ~500MB per Container | Native VPC Integration | Custom Python / Go Implemented | Uncaught DOM Timeout Exceptions |
In enterprise operating environments running alongside server maintenance software and automated remote server monitoring software, self-hosted deployment models offer the best visibility and access controls. Running headless scraping daemons behind private security groups lets infrastructure teams monitor internal staging environments, private API visual docs, and admin panels without opening holes in corporate firewalls.
Mechanics of DOM Diffing: Filtering Noise, Shadow DOM, and Volatile Tokens
Naive string diffs fail instantly on modern dynamic websites. When a crawler pulls a raw HTML response string, dynamic session identifiers, rotating nonce tokens, cache-busting asset paths, and dynamic ad elements constantly trigger false alarms. To accurately detect web page change events, an automated page update checker must parse raw HTML into a structured document object model, strip dynamic artifacts, and evaluate isolated subtrees.
Building a robust site update checker requires constructing deterministic extraction pipelines that handle dynamic components. A platform designed to monitor website content changes isolates targeted elements using robust CSS selectors, expands closed Shadow DOM branches via script injection, and normalizes string outputs before computing checksum hashes. This deterministic workflow ensures that every recorded web page change represents actual content modifications rather than transient document noise.
import hashlib
import re
from bs4 import BeautifulSoup

def clean_dom_snapshot(html_content: str, selector: str) -> str:
 soup = BeautifulSoup(html_content, "html.parser")

 # Purge volatile elements that cause transient noise
 for element in soup(["script", "style", "meta", "noscript", "svg"]):
 element.decompose()

 target_node = soup.select_one(selector)
 if not target_node:
 raise ValueError(f"Selector '{selector}' not found in document")

 raw_text = target_node.get_text(separator=" ", strip=True)

 # Normalize dynamic patterns: timestamps, UUIDs, and CSRF nonces
 normalized_text = re.sub(r"\b\d{4}-\d{2}-\d{2}T\d{2}:\d{2}:\d{2}(\.\d+)?Z?\b", "[TIMESTAMP]", raw_text)
 normalized_text = re.sub(r"\b[0-9a-fA-F]{8}-[0-9a-fA-F]{4}-[1-5][0-9a-fA-F]{3}-[89abAB][0-9a-fA-F]{3}-[0-9a-fA-F]{12}\b", "[UUID]", normalized_text)
 normalized_text = re.sub(r"\b[a-zA-Z0-9_-]{32,64}\b", "[SESSION_TOKEN]", normalized_text)
 normalized_text = re.sub(r"\s+", " ", normalized_text).strip()

 return normalized_text

def compute_content_checksum(normalized_text: str) -> str:
 return hashlib.sha256(normalized_text.encode("utf-8")).hexdigest()
For European engineering environments needing to systematically website überwachen (monitor websites) across international portals, selector filtering guarantees compliance with localized multi-language variations. Normalizing whitespace, stripping dynamic query parameters, and ignoring dynamic layout classes guarantees deterministic cryptographic hashes across every inspection sweep.
Never diff raw HTML markup directly. Always parse down to normalized inner text or strip variable structural attributes like dynamic classes (such as Tailwind dynamic hashes) before hashing the payload.
Deploying a Self-Hosted Web Page Update Monitoring Program with Playwright and Docker
Running an enterprise-grade web page update monitoring program requires combining an orchestration layer with a dedicated, isolated headless browser container. While lightweight scraping scripts handle plain HTML, modern applications require a full rendering engine to execute client-side bundles and expose dynamic content.
The standard self-hosted deployment pattern pairs changedetection.io with a decoupled Playwright browser driver. This separation isolates Chromium process execution, memory management, and zombie process cleanup from the core differential tracking daemon, allowing engineers to reliably watch page for changes across complex corporate applications.
services:
 changedetection:
 image: ghcr.io/dgtlmoon/changedetection.io:latest
 container_name: changedetection
 restart: unless-stopped
 environment:
 - PLAYWRIGHT_DRIVER_URL=ws://playwright-chrome:3000
 - WEBDRIVER_URL=http://playwright-chrome:4444/wd/hub
 volumes:
 -./changedetection-data:/datastore
 ports:
 - "5000:5000"
 depends_on:
 - playwright-chrome

 playwright-chrome:
 image: dgtlmoon/sockpuppetbrowser:latest
 container_name: playwright-chrome
 restart: unless-stopped
 environment:
 - SCREEN_WIDTH=1920
 - SCREEN_HEIGHT=1080
 - SCREEN_DEPTH=24
 - MAX_CONCURRENT_CHROME_PROCESSES=4
 cap_add:
 - SYS_ADMIN
 shm_size: '2gb'
To deploy and configure the system to watch site for changes with real browser rendering, follow these deployment steps:
- Initialize the Host Storage: Create a persistent directory on your host server using
mkdir -p./changedetection-data && chmod 777./changedetection-datato ensure proper file permissions across container restarts. - Provision Browser Containers: Deploy the stack using
docker compose up -d. The detached Chromium driver initializes an isolated display frame with 2GB of shared memory (shm_size) to prevent browser tab crashes during heavy DOM rendering. - Configure Selector Targeting: Access the local dashboard on port 5000, specify the target URL, and switch the extraction mode from Basic HTTP to Chrome Playwright. Set the CSS Selector property to target high-signal elements (such as
article.main-contentordiv#pricing-matrix). - Validate Layout Changes: Use ai website monitoring visual tools to verify that dynamic cookie notices, animated banners, and hydration shifts are excluded before committing the check cycle to production.
Telemetry Integration: Prometheus Blackbox Exporter and Alertmanager Pipelines
A standalone change detection tool without observability routing creates data silos. Transforming detection events into enterprise metrics requires exposing state changes through a Prometheus endpoint, letting operations teams monitor update events right inside corporate Grafana boards alongside application uptime data.
When an unexpected structural shift or unexpected layout change occurs, the pipeline can fire a real-time web change alert. If the target server crashes completely or blocks requests with upstream access denials, the pipeline routes an immediate website down notification through downstream Alertmanager receivers, letting you get alert when website changes or service degradations happen simultaneously.
from prometheus_client import start_http_server, Gauge
import time

CONTENT_HASH_GAUGE = Gauge(
 'web_endpoint_content_hash',
 'Cryptographic 64-bit integer hash of target DOM text',
 ['target_url', 'selector']
)
UPDATE_EVENT_COUNTER = Gauge(
 'web_endpoint_change_detected',
 'Fired as 1 when DOM update occurs between scrape intervals',
 ['target_url']
)
ENDPOINT_UP_GAUGE = Gauge(
 'web_endpoint_scrape_success',
 'Indicates if the target endpoint was retrieved successfully',
 ['target_url']
)

def export_telemetry_snapshot(url: str, selector: str, hash_int: int, changed: bool, success: bool):
 ENDPOINT_UP_GAUGE.labels(target_url=url).set(1 if success else 0)
 if success:
 CONTENT_HASH_GAUGE.labels(target_url=url, selector=selector).set(hash_int)
 UPDATE_EVENT_COUNTER.labels(target_url=url).set(1 if changed else 0)
These exposed gauge metrics let you configure Alertmanager rules to automatically alert when a website is updated, directing issues to corresponding engineering teams:
| Metric Expression | Severity | Routing Target | Action Required |
|---|---|---|---|
web_endpoint_scrape_success == 0 |
Critical | PagerDuty SRE Team | Investigate proxy block, IP ban, or server outage. |
changes(web_endpoint_content_hash[1h]) > 5 |
Warning | DevOps Slack Channel | Investigate volatile DOM nodes leaking dynamic nonces. |
web_endpoint_change_detected == 1 |
Info | Product / BI Webhook | Ingest updated catalog pricing or regulatory policy text. |
Factors That Affect Development Cost
- Headless Chromium memory requirements
- Scraping frequency and concurrent browser worker limits
- Residential or datacenter proxy network egress costs
- Self-hosted VPC hardware vs managed cloud subscription tiers
Infrastructure expenses scale based on the volume of headless browser processes and proxy egress bandwidth required.
Frequently Asked Questions
How do you get a notification when a website is updated?
To get a notification when a website is updated, configure a headless monitor like changedetection.io or a Playwright script. The engine extracts target DOM selectors, normalizes text, diffs cryptographic checksums, and dispatches webhooks to Slack, PagerDuty, or email.
What is the difference between uptime monitoring and a web update checker?
An uptime monitor verifies server availability and HTTP response codes. A web update checker launches a browser engine to render dynamic single-page applications, inspect the DOM tree, and verify visual or textual integrity beyond basic HTTP 200 statuses.
Can AI website monitoring detect anti-scraping and CAPTCHA interventions?
Yes, AI website monitoring tools identify layout anomalies caused by Cloudflare Turnstile screens, bot walls, and CAPTCHAs. Machine-learning heuristics distinguish structural anti-bot challenges from genuine functional page updates, preventing false-positive alerts.
How do enterprise pipelines eliminate alert fatigue from dynamic web elements?
Enterprise pipelines eliminate alert fatigue by scoping extraction strictly to deterministic CSS or XPath selectors. They apply regex filters to discard volatile timestamps, rotating ads, CSRF nonces, and session tokens before computing diffs.
What are critical engineering considerations for get notified when website updates?
When implementing get notified when website updates, prioritize deterministic execution, rigorous error handling, observability metrics, and strict security isolation to maintain production reliability and eliminate latency bottlenecks.
What are critical engineering considerations for website überwachen?
When implementing website überwachen, prioritize deterministic execution, rigorous error handling, observability metrics, and strict security isolation to maintain production reliability and eliminate latency bottlenecks.
What are critical engineering considerations for how to be notified when a website is updated?
When implementing how to be notified when a website is updated, prioritize deterministic execution, rigorous error handling, observability metrics, and strict security isolation to maintain production reliability and eliminate latency bottlenecks.
Modern web change verification requires moving past fragile HTML diffing tools. By pairing headless browser rendering through Playwright with selective DOM selector filtering, engineering teams can monitor dynamic web applications without false-positive alert fatigue. Transforming DOM state snapshots into cryptographic hashes and exposing them via Prometheus telemetry allows synthetic change detection to live natively alongside standard infrastructure observability stacks.
Audit your critical external dependencies, deploy self-hosted headless monitoring nodes in your internal private network, and wire selector-filtered change metrics straight into Alertmanager to secure deterministic visibility over dynamic web ecosystems.
Need Engineering Guidance for Your Production Stack?
Evaluate architecture trade-offs, scalability limits, and implementation feasibility with experienced systems engineers.