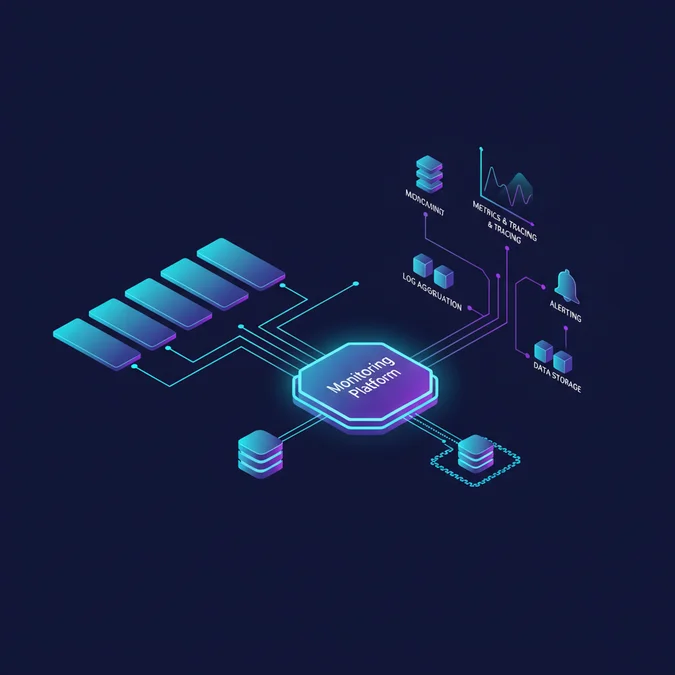

Application monitoring tracks the runtime health, execution latency, throughput, and error rates of software workloads by collecting metrics, distributed traces, and structured logs directly from application code and runtime environments. Modern observability demands real-time inspection of distributed systems without incurring untenable ingestion costs or degrading thread-pool latency.
When a distributed microservice deployment experiences cascading tail-latency spikes under load, generic CPU alerts fail to isolate the bottleneck. Resolving transient failures requires low-overhead instrumentation that exposes granular runtime metrics, database connection pool exhaustion, and upstream network saturation directly to telemetry pipelines.
This architectural guide breaks down how to construct resilient application telemetry systems. We compare self-hosted open-source stacks using Prometheus, OpenTelemetry, and Grafana against commercial SaaS platforms, providing production-ready scrape configurations, runtime instrumentation snippets, and techniques to mitigate high-cardinality label explosions.
Taxonomy of Modern Application Monitoring and Telemetry Architectures
Engineering teams must choose between monolithic all-in-one platforms and modular telemetry pipelines when designing an application monitoring strategy. An integrated application performance monitoring platform provides out-of-the-box auto-instrumentation, distributed tracing, and out-of-process metric aggregation inside a proprietary vendor agent. In contrast, modular architectures decouple data collection from metric storage, employing open standards like OpenTelemetry alongside dedicated time-series databases.
At the center of any modern application monitoring system is the split between in-process instrumentation runtimes and external aggregation daemons. In-process telemetry runs as a library within the application thread pool, maintaining atomic counters and histograms in local memory. Daemon architectures, such as sidecars or node agents, ingest these data streams asynchronously over local sockets or scrape endpoints, preventing telemetry transmission from blocking client request lifecycles.
+-------------------------------------------------------------+
| Kubernetes Pod |
| |
| +------------------------+ +-----------------------+ |
| | App Container | | OpenTelemetry Sidecar | |
| | | | | |
| | [Go / Python / Node] | | Collector Engine | |
| | | | | | | |
| | In-Process SDK | | Local Processing | |
| | (Atomic Counters) | | & Batch Filtering | |
| +------------|-----------+ +-----------|-----------+ |
| | | |
| +----> /metrics (Scrape) <-----+ |
+----------------------------------------------|--------------+
 | Push / Pull
 v
+-------------------------------------------------------------+
| Central Telemetry Platform |
| |
| Prometheus TSDB / Thanos / Cortex / SaaS Backend |
+-------------------------------------------------------------+
Architecture Note: Separating the metric collection path from the transport daemon ensures that a network partition between the node and the central monitoring storage never introduces backpressure into critical user-facing request paths.
Selecting data monitoring software and underlying data monitoring system components requires evaluating the entire lifecycle of an observable event: recording, transport, storage compaction, and querying. High-throughput distributed services process tens of thousands of requests per second; emitting telemetry per transaction requires optimized, zero-allocation buffers inside your software monitoring software layer.
Evaluating comprehensive software application monitoring tools involves reviewing five architectural criteria:
- Runtime Overhead: Metric updates must rely on lock-free primitives or atomic CPU instructions, adding sub-microsecond latency per trace span or counter increment.
- Transport Decoupling: Metric export should run asynchronously in a dedicated worker thread or via local loopback scraping.
- Cardinality Management: The engine must enforce strict schema limits on dynamic labels to prevent metric ingestion engines from running out of RAM.
- Standard Protocol Compliance: Telemetry interfaces should adhere to vendor-neutral specifications, such as OpenTelemetry and the Prometheus exposition format.
- Failure Isolation: Telemetry agent crashes must fail open, allowing primary business logic to proceed without interruption.
Core Mechanics: Prometheus Scraping, OpenTelemetry, and What Prometheus Does
To understand modern observability stacks, engineering teams must ask: what does prometheus do during production runtime? Prometheus functions as an active polling engine, metric store, and rules processor. Instead of requiring applications to push metrics to a remote ingestion endpoint, Prometheus periodically queries registered HTTP endpoints using a pull model, parsing metrics structured in the text-based Prometheus exposition format.
For robust web service monitoring and microservice tracking (often termed monitoreo de servicios in global deployments), Prometheus leverages service discovery mechanisms natively integrated with Kubernetes, Consul, or cloud provider APIs. This transforms Prometheus into an automated application monitor software engine that dynamically maps targets as pods scale up or terminate.
Below is a production-ready Prometheus scrape configuration demonstrating service discovery, label sanitization, and relabel configurations to monitor application endpoints securely:
scrape_configs:
 - job_name: 'kubernetes-services'
 scrape_interval: 15s
 scrape_timeout: 10s
 metrics_path: /metrics
 scheme: http

 kubernetes_sd_configs:
 - role: endpoints
 namespaces:
 names:
 - production

 relabel_configs:
 - source_labels: [__meta_kubernetes_service_annotation_prometheus_io_scrape]
 action: keep
 regex: true
 - source_labels: [__meta_kubernetes_service_annotation_prometheus_io_scheme]
 action: replace
 target_label: __scheme__
 regex: (https?)
 - source_labels: [__meta_kubernetes_service_annotation_prometheus_io_path]
 action: replace
 target_label: __metrics_path__
 regex: (.+)
 - source_labels: [__address__, __meta_kubernetes_service_annotation_prometheus_io_port]
 action: replace
 target_label: __address__
 regex: ([^:]+)(?:\d+)?(\d+)
 replacement: $1:$2
 - action: labelmap
 regex: __meta_kubernetes_service_label_(.+)
Scrape Mechanics: The Prometheus pull model provides immediate dead-target detection. If an instance locks up or experiences out-of-memory termination, the missing scrape target immediately transitions the
upmetric to0, triggering alert evaluation without relying on synthetic external health probes.
In a distributed app monitoring system, OpenTelemetry handles the client-side collection of traces and metrics, while Prometheus acts as the time-series metric engine. OpenTelemetry SDKs embedded in your application services emit metrics over OTLP (OpenTelemetry Protocol) via gRPC to a local collector, which can then either expose a Prometheus /metrics scrape target or forward data directly to backend storage engines.
Evaluating Modern Solutions: Open Source Telemetry vs Cloud Platforms
When selecting cloud monitoring software, systems architects face a key tradeoff: building on an open-source, vendor-neutral ecosystem or adopting managed proprietary app monitoring tools. Open-source ecosystems powered by Prometheus, OpenTelemetry, Thanos, and Grafana provide total data ownership, custom scrape control, and zero per-host agent licensing fees. However, they place operational maintenance, storage scaling, and retention policies directly on your site reliability engineering team.
Conversely, commercial app monitoring software offers turnkey APM tracing, automated anomaly detection, and unified log-to-metric correlation within a fully hosted cloud based monitoring system. The primary operational risk with managed platforms is unchecked cost: high-cardinality telemetry or unexpected traffic surges can trigger exponential billing spikes.
To navigate the broader application performance monitoring tools list, architects must evaluate how specialized cloud native monitoring tools compare against fully managed application performance management tools open source stacks and modern application performance monitoring products.
| Evaluation Dimension | Prometheus + OpenTelemetry + Grafana | Metrics as a Service (Managed Prometheus/Cloud) | Proprietary SaaS APM Platforms |
|---|---|---|---|
| Ingestion Mechanism | Pull via HTTP scrape endpoints or OTLP Collector push | Remote-write push (PromQL compatible) | Proprietary agent push over TLS / OTLP |
| High-Cardinality Handling | Memory scales linearly with series; requires downsampling or M3DB/Thanos | Cloud-managed auto-scaling; billed directly per active series | Aggressive server-side dropping, indexing caps, or high per-metric fees |
| Storage Architecture | Local append-only TSDB blocks with object storage sync (Thanos) | Managed multitenant block storage (S3/GCS backend) | Proprietary columnar datastores with fixed data retention tiers |
| Throughput and Scalability | 1M to 5M samples/sec per node; requires clustering for higher load | Scales past 50M+ samples/sec dynamically | Scales transparently; subject to hard account ingestion rate limits |
| Total Cost of Ownership (TCO) | Zero software licensing costs; compute and operational SRE time required | Predictable usage pricing; eliminates infrastructure maintenance | High per-host, per-seat, and per-GB ingestion pricing |
| Trace & Log Correlation | Manual cross-linking using trace IDs and Grafana Tempo/Loki | Unified via Grafana Cloud or AWS CloudWatch | Automated root-cause tracing and log mapping out-of-the-box |
For organizations looking to eliminate self-hosted storage maintenance without vendor lock-in, adopting metrics as a service provides an ideal middle path. These cloud-managed engines accept standard Prometheus remote_write streams, letting teams leverage open-source instrumentation while delegating compaction and long-term storage tasks.
Instrumenting Web Services and Application Servers for Low-Latency Observability
Deploying a production-grade real time monitoring system requires developers to instrument web services at the transport and controller layers. Effective application server monitoring measures the Golden Signals: latency, traffic, errors, and saturation. Relying solely on external load balancer metrics hides internal thread pool contention, database query bottlenecks, and garbage collection pauses.
To establish resilient real time application monitoring and internal app server monitoring, implement in-process instrumentation using the following step-by-step workflow:
- Initialize Core Metrics: Define thread-safe atomic counters and histograms in your service startup code, pre-allocating histogram buckets to track tail latencies accurately.
- Inject Middleware: Intercept every HTTP request to capture response codes, path routing templates (preventing raw variable IDs from leaking into labels), and execution time.
- Record Contextual Observability: Extract incoming trace context headers to correlate metric spikes with distributed trace spans.
- Expose Telemetry Safely: Serve metrics over a dedicated internal network port or unexposed URL path to prevent internal runtime statistics from leaking to public networks.
Below is a production-grade Go HTTP web service implementation using the official Prometheus client library, demonstrating the RED (Rate, Errors, Duration) pattern with accurate label sanitization:
package main

import (
 "net/http"
 "strconv"
 "time"

 "github.com/prometheus/client_golang/prometheus"
 "github.com/prometheus/client_golang/prometheus/promhttp"
)

var (
 httpRequestsTotal = prometheus.NewCounterVec(
 prometheus.CounterOpts{
 Name: "http_requests_total",
 Help: "Total number of HTTP requests processed, partitioned by status code and handler.",
 },
 []string{"handler", "method", "code"},
 )

 httpRequestDuration = prometheus.NewHistogramVec(
 prometheus.HistogramOpts{
 Name: "http_request_duration_seconds",
 Help: "Histogram of latencies for HTTP requests in seconds.",
 Buckets: []float64{0.005, 0.01, 0.025, 0.05, 0.1, 0.25, 0.5, 1.0, 2.5, 5.0},
 },
 []string{"handler", "method"},
 )
)

func init() {
 prometheus.MustRegister(httpRequestsTotal)
 prometheus.MustRegister(httpRequestDuration)
}

type statusResponseWriter struct {
 http.ResponseWriter
 statusCode int
}

func (rw *statusResponseWriter) WriteHeader(code int) {
 rw.statusCode = code
 rw.ResponseWriter.WriteHeader(code)
}

func instrumentRoute(handlerName string, next http.HandlerFunc) http.HandlerFunc {
 return func(w http.ResponseWriter, r *http.Request) {
 start:= time.Now()
 sw:= &statusResponseWriter{ResponseWriter: w, statusCode: http.StatusOK}

 next.ServeHTTP(sw, r)

 duration:= time.Since(start).Seconds()
 httpRequestDuration.WithLabelValues(handlerName, r.Method).Observe(duration)
 httpRequestsTotal.WithLabelValues(handlerName, r.Method, strconv.Itoa(sw.statusCode)).Inc()
 }
}

func healthHandler(w http.ResponseWriter, r *http.Request) {
 w.WriteHeader(http.StatusOK)
 w.Write([]byte(`{"status":"healthy"}`))
}

func main() {
 mux:= http.NewServeMux()
 mux.HandleFunc("/api/v1/health", instrumentRoute("health", healthHandler))
 mux.Handle("/metrics", promhttp.Handler())

 server:= &http.Server{
 Addr: ":8080",
 Handler: mux,
 ReadTimeout: 5 * time.Second,
 WriteTimeout: 10 * time.Second,
 }

 if err:= server.ListenAndServe(); err!= nil && err!= http.ErrServerClosed {
 panic("Server failed: " + err.Error())
 }
}
Alerting Rules, Alertmanager Routing, and Desktop Incident Notification
Telemetry data is only as effective as the alerting pipeline that routes actionable signals to engineers. Deploying reliable application management tools requires avoiding alerting fatigue by moving away from static threshold alerts (like CPU > 80%) toward customer-facing Service Level Objectives (SLOs) and Multi-Window Multi-Burn-Rate alerting.
A modern application monitoring service relies on Prometheus Alertmanager to deduplicate, group, and route alert notifications. Alertmanager orchestrates incident distribution across PagerDuty, webhook receivers, and local notification tools, including an open source desktop alert software client used by on-call engineers to catch alerts directly on their workstations.
Below is a production PromQL alerting configuration evaluating 5-minute and 1-hour error burn rates along with tail latency degradations:
groups:
 - name: application_slo_alerts
 rules:
 - alert: HighRequestLatencyP99
 expr: |
 histogram_quantile(0.99, sum(rate(http_request_duration_seconds_bucket{job="kubernetes-services"}[5m])) by (le, handler))
 > 0.500
 for: 2m
 labels:
 severity: critical
 tier: backend
 annotations:
 summary: "Degraded latency on endpoint {{ $labels.handler }}"
 description: "99th percentile request duration exceeds 500ms (current: {{ $value }}s) for more than 2 minutes."

 - alert: ServiceErrorRateBurn
 expr: |
 sum(rate(http_requests_total{job="kubernetes-services", code=~"5."}[5m]))
 /
 sum(rate(http_requests_total{job="kubernetes-services"}[5m]))
 > 0.05
 for: 1m
 labels:
 severity: critical
 team: platform
 annotations:
 summary: "Elevated 5xx error rate across service"
 description: "HTTP error rate is at {{ $value | humanizePercentage }} over the last 5 minutes."

 - alert: AppDeadlockOrOOMKilled
 expr: up{job="kubernetes-services"} == 0
 for: 30s
 labels:
 severity: page
 annotations:
 summary: "Instance {{ $labels.instance }} is unreachable"
 description: "Application process crashed, failed liveness checks, or terminated abruptly."
Alertmanager routing logic aggregates these alerts to prevent notification storms when an underlying dependency fails. The following Alertmanager routing configuration groups alerts by cluster and alertname while routing critical events to specific endpoints:
global:
 resolve_timeout: 5m

route:
 group_by: ['alertname', 'cluster', 'service']
 group_wait: 30s
 group_interval: 5m
 repeat_interval: 4h
 receiver: 'default-webhook'
 routes:
 - match:
 severity: page
 receiver: 'pager-gateway'
 continue: true
 - match:
 tier: backend
 receiver: 'desktop-notifier-bridge'

receivers:
 - name: 'default-webhook'
 webhook_configs:
 - url: 'http://alert-bridge.internal.net/v1/events'
 - name: 'pager-gateway'
 webhook_configs:
 - url: 'https://events.pagerduty.com/v2/enqueue'
 - name: 'desktop-notifier-bridge'
 webhook_configs:
 - url: 'http://localhost:19822/alerts/broadcast'
SRE Operational Rule: Alerts must be actionable. Every firing alert must represent an immediate threat to user experience or service availability, accompanied by a link to a documented remediation runbook.
Comprehensive application monitoring solutions combine these server-side rules with fast desktop triage, enabling platform engineers to spot early warnings long before an outage breaches critical customer SLA budgets.
Constructing Unified Server Monitoring Dashboards Without Cardinality Traps
A high-performance server monitoring dashboard bridges the gap between low-level host metrics (CPU, page faults, disk I/O) and high-level application transactions. However, poorly structured metric designs risk cardinality explosions, where metric labels with infinite unique values overwhelm Prometheus memory, causing TSDB compaction crashes.
High cardinality occurs when unconstrained values, such as raw UUIDs, email addresses, or unnormalized URLs, are used as Prometheus label values. Each distinct combination of key-value pairs instantiates a new time series in memory. Storing 100,000 unique customer IDs on a single metric instantly multiplies memory overhead by 100,000 times.
To safeguard your time-series storage, review this operational checklist when designing dashboards and instrumentation schemas:
- Normalize URL Routes: Never include raw parameters in endpoint labels; map
/users/41289/profileto the static route pattern/users/:id/profile. - Strip Ephemeral IDs: Exclude raw JSON-RPC transaction identifiers, session tokens, and timestamps from metric labels entirely.
- Enforce Target Scrape Limits: Set strict limits on series per target using Prometheus
sample_limitconfigurations to isolate misbehaving containers. - Filter Unused Host Labels: Use scrape relabeling to drop unnecessary system metadata before samples hit the TSDB storage layer.
Use this Prometheus relabeling snippet to drop high-cardinality metadata and block unbounded label values before ingestion:
scrape_configs:
 - job_name: 'production-apps'
 sample_limit: 5000
 static_configs:
 - targets: ['app-server.internal:8080']
 metric_relabel_configs:
 - source_labels: [user_id]
 action: labeldrop
 - source_labels: [session_token]
 action: labeldrop
 - source_labels: [__name__]
 regex: 'temporary_debug_.*'
 action: drop
To locate existing label cardinality problems within an active Prometheus instance, execute these diagnostic queries via the Prometheus HTTP API:
# Top 10 highest cardinality metrics in memory
topk(10, count by (__name__) ({__name__=~".+"}))

# Count the number of active time series across a single service
count({job="kubernetes-services"})
By enforcing clean label schemas and decoupling host metrics from application-level execution spans, your dashboards will load within milliseconds while keeping TSDB storage lean and cost-effective.
Factors That Affect Development Cost
- Active metric time-series volume and total data ingestion rate
- Retention window duration and long-term object storage requirements
- Telemetry agent deployment model (self-hosted compute vs managed SaaS ingest fees)
- Cross-region data egress for centralized metric collection backends
TCO varies significantly between self-hosted Kubernetes clusters incurring internal compute overhead and SaaS platforms billing on dynamic data ingestion or active series counts.
Frequently Asked Questions
What is the primary difference between application monitoring and infrastructure monitoring?
Application monitoring tracks software execution health, request latency, throughput, and error rates from within runtime environments. Infrastructure monitoring assesses host hardware, virtual machine metrics, and network interfaces. Combining both ensures end-to-end visibility across both the underlying infrastructure and the running service layer.
What does Prometheus do in an application monitoring stack?
Prometheus periodically scrapes HTTP telemetry endpoints exposed by application runtimes, stores numeric metrics as time-series data with dynamic key-value labels, evaluates PromQL alerting rules, and triggers alerts via Alertmanager to notify operations teams during service degradations.
How do open source application performance management tools compare to SaaS APMs?
Open source application performance management tools like Prometheus, OpenTelemetry, and Grafana provide vendor neutrality, zero per-host licensing fees, and total data sovereignty. In contrast, proprietary SaaS APMs offer turnkey instrumentation and automated root-cause heuristics at the expense of higher ingestion costs.
What is metrics as a service and when should engineering teams use it?
Metrics as a service provides a managed, cloud-hosted time-series backend such as Amazon Managed Prometheus or Grafana Cloud. It offloads storage compaction, long-term retention, and high availability maintenance, allowing engineering teams to focus solely on instrumentation and operational telemetry analysis.
Building a robust application monitoring architecture requires balancing granular runtime visibility with operational cost and storage overhead. By combining OpenTelemetry instrumentation, Prometheus pull-based collection, and multi-window SLO alerting, engineering organizations establish an observable platform that scales gracefully with traffic growth.
Audit your services for unbounded label cardinality, convert static threshold alerts into actionable SLO burn rates, and ensure in-process instrumentation isolates request lifecycles from metric serialization overhead.
Need Engineering Guidance for Your Production Stack?
Evaluate architecture trade-offs, scalability limits, and implementation feasibility with experienced systems engineers.