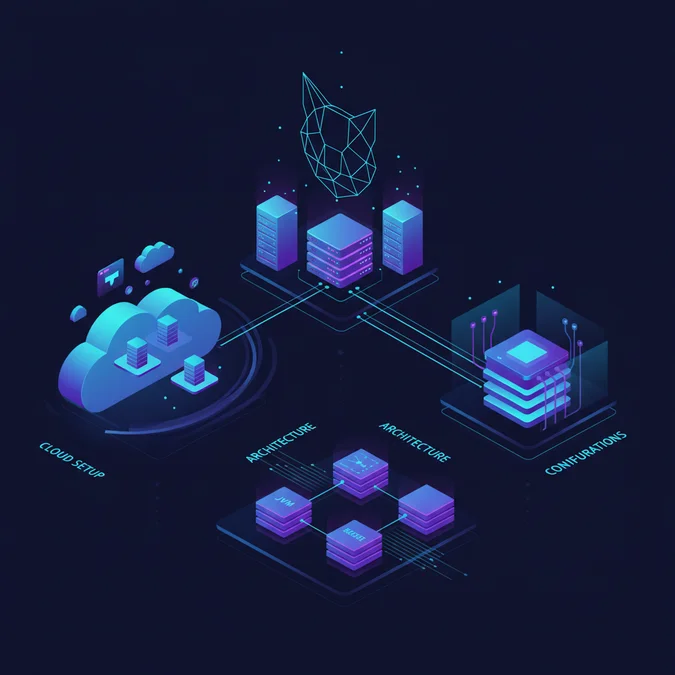

Tomcat remote debugging connects an IDE debugger to an Apache Tomcat JVM via the Java Debug Wire Protocol over a dedicated network socket. You enable it by configuring the JPDA_OPTS or JAVA_TOOL_OPTIONS environment variables with the jdwp agent parameters, allowing line-by-line inspection of running Java containers, cloud instances, or production replicas.
The Apache Tomcat Project maintains JPDA (Java Platform Debugger Architecture) tooling natively in the startup scripts across Tomcat 9, 10, and 11. The current maintainer roadmap emphasizes tighter alignment with modern OpenJDK modular runtimes, container-native signals, and enhanced secure transport bindings. Modern deployments decouple debugging agents from static shell modifications, favoring runtime injection via orchestration layers.
Operating remote debug sessions in cloud environments introduces major networking, security, and performance complexities. Opening an unauthenticated debug port to the public internet risks arbitrary code execution, while pausing JVM threads inside an autoscaling group triggers cascade failovers. This guide breaks down the underlying wire protocol, exact operational commands, container topologies, and secure cloud networking designs for enterprise infrastructure.
How Java Debug Wire Protocol Operates Within Apache Tomcat
At the center of Tomcat remote debugging is the Java Debug Wire Protocol (JDWP). JDWP is the communication protocol between a running JVM (the debuggee) and an external developer tool (the debugger). Rather than instrumenting application bytecode dynamically like APM tools do, JDWP operates inside the JVM via the Java Virtual Machine Tool Interface (JVMTI). This native C/C++ interface gives the debugger fine-grained control over execution flow, heap memory state, class definitions, and active thread stacks.
When the JVM initializes with JDWP enabled, it dynamically loads the jdwp.so (on Linux) or jdwp.dll (on Windows) library. This library allocates internal buffers, registers thread lifecycle event hooks, and binds to a designated TCP port. The protocol payload consists of simple, binary-encoded packets containing command sets, command IDs, flags, and data payloads. Both packets and responses travel unencrypted by default, meaning any observer capable of tapping the network interface can read memory references, local variable states, and injected bytecode.
Understanding the exact socket lifecycle helps prevent connection timeouts during complex network routing:
- Socket Binding: The debug agent opens a server socket on the target host (e.g.
*:8000). - Handshake Sequence: When the IDE connects, it sends an ASCII byte sequence:
JDWP-Handshake. The debuggee must respond with the exact same ASCII string before any debug command packets are exchanged. - Command Exchange: The IDE issues command sets such as
VirtualMachine (1),ReferenceType (2), andEventRequest (15)to establish breakpoints, monitor class preparation, and inspect variables. - Suspend Policies: Breaked execution can either suspend only the thread encountering the event (
SUSPEND_EVENT_THREAD) or pause every active thread inside the JVM (SUSPEND_ALL).
The suspend policy choice directly impacts infrastructure stability. Using SUSPEND_ALL halts Tomcat internal heartbeat monitors, health check responses, and database connection validation routines.
Configuring JPDA Options in Modern Tomcat Environments
Standard Tomcat distributions provide native wrapper scripts to launch the server in debug mode without requiring hardcoded flags inside catalina.sh. The built-in catalina.sh jpda start command checks for predefined environment variables to assemble the JVM launch parameters.
Historically, developers modified catalina.sh directly, which created maintenance debt during version upgrades. The standard method is creating an executable file named bin/setenv.sh (or bin/setenv.bat on Windows). Tomcat executes this file upon initialization if it exists, keeping your operational configurations cleanly decoupled from the upstream binaries.
Tomcat remote debugging remains an indispensable tool for diagnosing complex, environment-specific failures across Java enterprise deployments. By moving away from brittle, direct port exposure and adopting encrypted tunnels, containerized configurations, and production-safe observability alternatives, engineering teams can inspect distributed workloads without compromising security or availability.Balancing deep JVM inspection against the strict uptime demands of modern cloud architectures requires deliberate infrastructure design. Treat remote debug ports as high-risk vectors, prioritize automated thread dumps and structured logs in production clusters, and reserve interactive execution pauses for isolated preview environments.
References & Further Reading