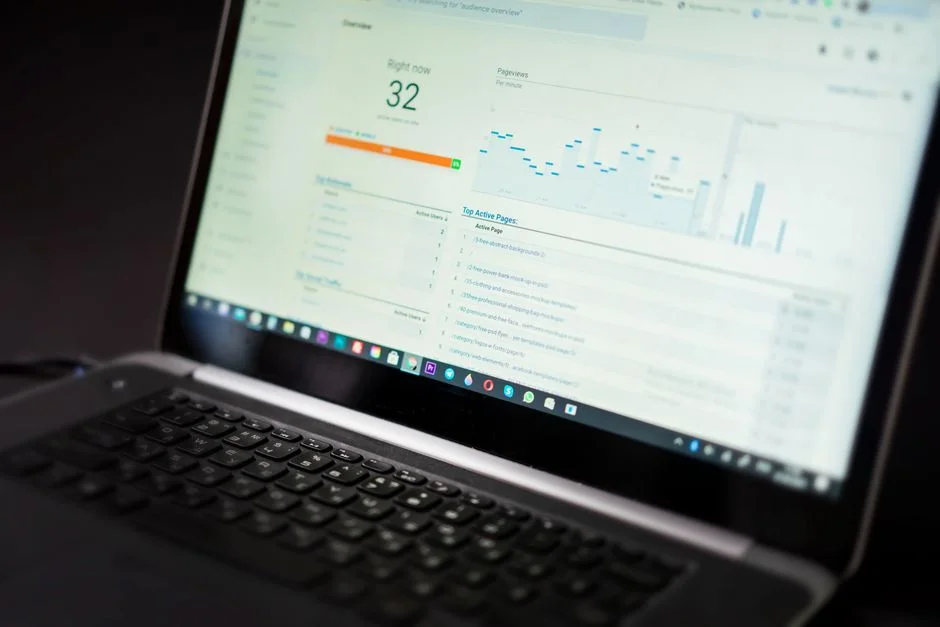
Building a dashboard web application is often the most critical technical undertaking for a growing business. A dashboard is not merely a collection of charts; it is the central nervous system of your operations, providing real-time visibility into key performance indicators (KPIs) and operational metrics. For CTOs and startup founders, the challenge lies in balancing real-time data ingestion, complex state management, and an intuitive user interface that remains performant under heavy load.
This guide outlines the architectural decisions required to build a scalable dashboard. We focus on the technical stack, data flow architecture, and the design principles that differentiate a high-performance analytical tool from a slow, bloated interface. Whether you are aggregating data from internal ERP systems or external APIs, your choice of architecture will dictate your technical debt for years to come.
Defining the Architectural Foundation
The foundation of a robust dashboard rests on a clean separation between the data ingestion layer and the presentation layer. You should aim for a decoupled architecture where your frontend communicates with a dedicated backend API. For most modern applications, a Next.js or React frontend paired with a Laravel or Node.js backend provides the best balance of productivity and performance.
- Data Orchestration: Use a background processing queue to handle heavy data aggregation, preventing the main thread from locking up during report generation.
- State Management: Avoid global state bloat by utilizing server-state libraries like TanStack Query. This allows you to cache API responses effectively, reducing unnecessary network requests.
- Security: Implement Row-Level Security (RLS) if you are using a database like Supabase, or strict middleware authorization in Laravel to ensure users only see data they are permitted to access.
Selecting the Right Technology Stack
Your technology stack choice directly impacts development velocity and long-term maintainability. We recommend a stack that emphasizes type safety and efficient rendering.
| Component | Recommended Technology |
|---|---|
| Frontend | Next.js with TypeScript |
| Styling | Tailwind CSS |
| Backend | Laravel (PHP) or Node.js |
| Database | MySQL or PostgreSQL |
| Charts/Visualization | Recharts or Nivo |
TypeScript is non-negotiable here. When dealing with complex data structures returned from an API, having strongly typed interfaces prevents runtime errors that are notoriously difficult to debug in dashboard environments.
Implementing the Five-Second Rule for Dashboards
The ‘five-second rule’ for dashboards dictates that a user should be able to derive a meaningful insight within five seconds of viewing the data. This is not about page load speed alone; it is about information architecture. If your users have to scan through fifty widgets to find a single metric, your design has failed.
- Prioritize KPIs: Place the most critical metrics in the top-left quadrant, as this is where the human eye naturally begins scanning.
- Progressive Disclosure: Provide high-level summaries first, and allow users to click into specific widgets for detailed, granular breakdowns.
- Lazy Loading: Do not fetch all widget data on the initial page load. Load critical metrics immediately and lazy-load secondary charts as the user scrolls.
Data Aggregation and Performance Optimization
Performance bottlenecks in dashboards typically stem from inefficient database queries. When you need to display trends over time, fetching raw data and calculating it on the fly is a recipe for disaster. Instead, implement a caching strategy.
For example, in a Laravel environment, you should use cached aggregates:
// Example: Caching a metric for 10 minutes

$dailyRevenue = Cache::remember('daily_revenue', 600, function () {

    return Order::where('created_at', '>=', now()->startOfDay())->sum('total');

});
By pre-calculating metrics during off-peak hours or using materialized views in your database, you ensure that the API response time remains under 200ms, regardless of the size of your underlying dataset.
Tradeoffs in Dashboard Development
A common tradeoff exists between real-time data accuracy and system performance. Real-time streaming (via WebSockets) is expensive to maintain and can overwhelm your database if every user triggers updates simultaneously. In most cases, a polling strategy with intelligent cache invalidation provides 95% of the value at 10% of the complexity.
Another tradeoff is between custom-built visualizations and off-the-shelf charting libraries. Custom SVG charts provide total control over branding and interactivity but require significant maintenance. Standard libraries like Recharts are faster to implement but may struggle with highly specific, non-standard data representations.
Security and Compliance Considerations
Since dashboards often display sensitive internal data, security must be baked into the development process. Always use parameterized queries to prevent SQL injection and ensure that your API endpoints enforce strict authentication and authorization checks.
If your dashboard handles financial or healthcare data, you must log all access attempts. Implementing audit trails at the database level ensures you have a record of who viewed what data and when. Additionally, ensure all data in transit is encrypted using TLS 1.3, and consider implementing rate limiting on your API to prevent scraping or brute-force attempts.
Factors That Affect Development Cost
- Complexity of data integration and ETL pipelines
- Number of unique visualization types required
- Real-time update frequency requirements
- Security and compliance auditing needs
- Scale of concurrent users
Development costs vary based on the depth of integrations and the sophistication of the analytical engine required.
Frequently Asked Questions
How to create a dashboard in a web application?
Creating a dashboard involves setting up a backend API to aggregate your data, designing a clean frontend interface using a component-based library like React, and implementing a caching strategy to ensure the charts load quickly.
How do I build my own dashboard?
To build your own dashboard, start by defining your core metrics, then choose a tech stack like Next.js and Tailwind CSS. Focus on building reusable chart components and ensuring your API endpoints are optimized for fast data delivery.
What is a dashboard in a web application?
A dashboard is a user interface that visualizes complex data sets into actionable metrics and KPIs. It provides a centralized view of performance, allowing users to monitor operations and make data-driven decisions.
What is the 5 second rule for dashboards?
The 5 second rule suggests that a user should be able to identify key insights or understand the current status of their metrics within five seconds of looking at the dashboard. If they cannot, the dashboard is likely cluttered or poorly prioritized.
Building a successful dashboard is a balance of performance, clarity, and security. By focusing on efficient data aggregation, choosing a robust stack like Next.js or Laravel, and adhering to the principle of progressive disclosure, you can create a tool that genuinely empowers your team to make better decisions.
At NR Studio, we specialize in building high-performance, custom software solutions tailored to your business needs. If you are ready to build a dashboard that scales with your company, contact our team to discuss your project requirements.
NR Studio builds custom web apps, mobile apps, SaaS platforms, and internal tools for growing businesses. If you’re working through a technical decision, feel free to reach out — no commitment required.