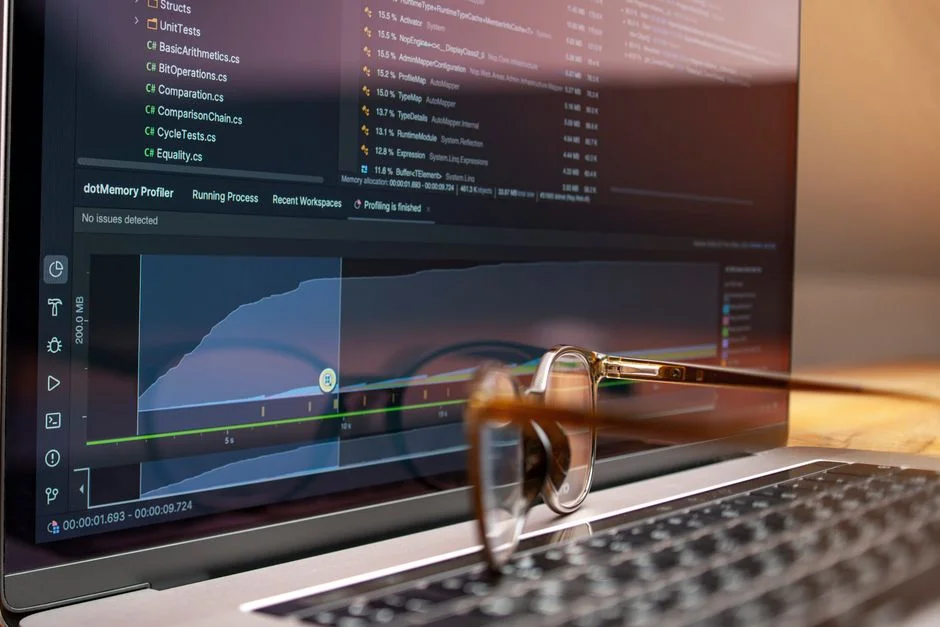
In modern software architecture, visibility is not a luxury; it is a fundamental requirement for operational stability. Application Performance Monitoring (APM) serves as the diagnostic layer that transforms raw system noise into actionable telemetry. For CTOs and technical founders, APM is the bridge between user-facing latency issues and the underlying code execution that causes them.
This guide examines the mechanics of APM, the architectural trade-offs involved in instrumentation, and the decision-making framework required to implement observability that actually scales. We move beyond basic uptime tracking to explore distributed tracing, transaction profiling, and the long-term impact of observability on technical debt.
The Core Mechanics of APM
At its technical foundation, APM is a collection of telemetry data—metrics, logs, and traces—collected from the application runtime. Unlike simple heartbeat monitors that check if a server is reachable, APM observes the internal state of the application. It hooks into the runtime environment (e.g., Node.js event loop, PHP-FPM worker pools, or JVM garbage collection) to record how resources are consumed during specific requests.
- Metrics: Aggregated numerical data such as CPU usage, memory pressure, and request throughput.
- Distributed Traces: A representation of a request as it traverses multiple services, databases, and microservices.
- Logs: Structured event data that provides context for specific errors or anomalies.
The primary challenge in APM is the overhead of data collection. Every instrumentation hook consumes CPU cycles and memory. In high-traffic environments, indiscriminate logging or overly verbose tracing can degrade application performance, creating the exact latency issues you are trying to solve.
Distributed Tracing and Request Context
In monolithic applications, tracking a request is straightforward. In modern distributed systems, a single user action might trigger calls across a React frontend, a Next.js API route, a Laravel backend, and a MySQL database cluster. Distributed tracing solves this by injecting a unique Trace ID into the header of every request.
When an incoming request hits your entry point, the APM agent attaches a Trace ID. As that request propagates downstream, every service passes this ID forward. This allows you to visualize the entire lifecycle of a request in a waterfall diagram. You can identify exactly which service or database query is introducing latency, rather than guessing based on aggregate averages.
Performance Considerations and Overhead
Instrumentation is not free. When selecting an APM strategy, you must account for the impact on your production environment. For instance, in a high-concurrency Laravel application, enabling full stack-trace logging for every request can cause I/O bottlenecks. Engineers typically use sampling to mitigate this.
| Technique | Benefit | Trade-off |
|---|---|---|
| Adaptive Sampling | Reduces data volume | May miss rare edge-case bugs |
| Head-based Sampling | Low CPU overhead | Decisions made without full context |
| Tail-based Sampling | High accuracy for errors | Requires buffering logs in memory |
We recommend starting with a 1% to 5% sample rate in production for traces, while keeping error-rate logging at 100%.
The Decision Framework: Choosing an APM Strategy
When deciding on an APM implementation, categorize your needs based on your stack and scale. If you are running a monolithic PHP application, simple log aggregation and basic transaction monitoring are often sufficient. If you are operating a complex SaaS product with multiple microservices, you require full distributed tracing.
Build vs. Buy: Building an observability stack using open-source tools like OpenTelemetry and Prometheus requires significant engineering time for maintenance and dashboard configuration. Buying a managed SaaS APM solution reduces maintenance but introduces vendor lock-in and potential data privacy concerns. For most scaling startups, the managed route is the more efficient use of engineering hours.
Common Anti-Patterns in Monitoring
One common mistake is treating APM as a substitute for performance optimization. If your application has an N+1 query problem, an APM tool will show you the latency, but it will not fix the code. Another anti-pattern is ‘alert fatigue,’ where teams configure too many alerts based on CPU spikes that do not impact user experience.
Focus your alerting strategy on Service Level Objectives (SLOs) rather than system-level metrics. If CPU usage hits 90% but response times remain within the 200ms target, the system is performing correctly. Alerting on the symptom (high latency) is more effective than alerting on the cause (high CPU) in many scenarios.
Integrating APM into the CI/CD Pipeline
Modern APM is most effective when integrated into the deployment lifecycle. By correlating code deployments with performance regressions, you can instantly identify which commit caused a spike in memory usage or latency. This is often achieved through deployment markers in your APM dashboard.
Before a release, run ‘canary’ deployments where a small subset of traffic is routed to the new code, and your APM tool monitors the error rate. If the error rate exceeds a threshold, the CI/CD pipeline should automatically roll back the deployment. This prevents minor bugs from impacting the entire user base.
Factors That Affect Development Cost
- Data ingestion volume
- Retention period for logs and traces
- Number of instrumented services
- Sampling frequency
Costs typically scale linearly with data volume and the complexity of your microservices architecture.
Frequently Asked Questions
What is APM (Application Performance Monitoring)?
APM is the practice of tracking software metrics and performance data to ensure applications meet defined service levels and to identify the root cause of performance issues.
What is the best Application Performance Monitoring tool?
The best tool depends on your stack, but industry leaders include Datadog, New Relic, and Dynatrace for enterprise, or OpenTelemetry with Grafana for teams prioritizing open-source control.
What is the purpose of APM logs?
APM logs provide specific, structured context for errors and performance bottlenecks, allowing developers to see exactly what state the application was in when a failure occurred.
Application Performance Monitoring is not just about keeping the lights on; it is about building a culture of data-driven development. By choosing the right instrumentation strategy and focusing on user-centric SLOs, you gain the clarity needed to scale your infrastructure confidently.
At NR Studio, we specialize in building high-performance software that is instrumented for success from day one. Whether you are optimizing a legacy system or architecting a new SaaS platform, our team ensures your application is observable and resilient. Contact us today to discuss how we can help you scale your software development operations.
NR Studio builds custom web apps, mobile apps, SaaS platforms, and internal tools for growing businesses. If you’re working through a technical decision, feel free to reach out — no commitment required.