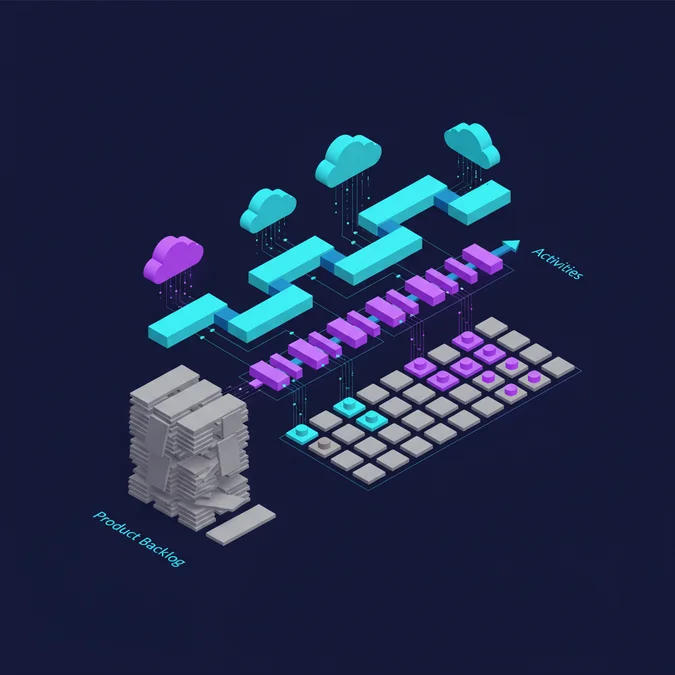

A user experience map is an empirical, vendor-agnostic visualization of the end-to-end human journey across a problem domain, capturing user mental models, behavioral stages, emotional states, and structural friction points independent of any single software interface. While traditional product roadmaps prioritize feature delivery cadences, unanchored software development frequently optimizes local service performance while compounding global workflow failure. When platform teams deploy features without modeling the broader human context, users face fragmented transitions between heterogeneous systems, uncoordinated error states, and unaddressed cognitive overload.
Engineering high-performing products requires grounding systems architecture directly in human operational realities. By establishing an objective user experience map, cross-functional teams establish a shared taxonomy that bridges qualitative discovery sessions with quantitative telemetry events, continuous integration pipelines, and backlog prioritization models. Rather than relying on superficial, static whiteboard diagrams that decay post-launch, modern organizations treat experience maps as living engineering artifacts that continuously inform distributed systems design, API surface areas, and service-level objectives.
Anatomy and Structural Layers of a User Experience Map
A robust user experience map decouples human intent from tactical user interface mechanics. Where tactical wireframes model button clicks within a discrete application, an experience map charts how a human fulfills an objective across diverse environments, physical contexts, third-party software, and asynchronous communication channels. The structural integrity of a user experience map relies on a standardized, multi-tiered horizontal architecture that systematically links subjective human perception to empirical operational boundaries.
System Rule: An experience map must remain vendor-agnostic. If a step in your top behavioral tier requires a user to click a proprietary UI component, you are modeling a tactical interaction flow, not a systemic user experience map.
+---------------------------------------------------------------------------------------------------------+
| USER EXPERIENCE MAP ARCHITECTURE |
+---------------------------------------------------------------------------------------------------------+
| Phase 1: Problem Awareness | Phase 2: Evaluation & Triage | Phase 3: Remediation & Resolution |
+----------------------------------+-----------------------------------+-----------------------------------+
| [Human Intent] | [Human Intent] | [Human Intent] |
| Detect anomalous system activity | Isolate root cause blast radius | Execute rollout and verify health |
+----------------------------------+-----------------------------------+-----------------------------------+
| [Cognitive & Emotional State] | [Cognitive & Emotional State] | [Cognitive & Emotional State] |
| High anxiety, context switching | Frustration, sensory fatigue | Cautious optimism, mental relief |
+----------------------------------+-----------------------------------+-----------------------------------+
| [Friction & Blindspots] | [Friction & Blindspots] | [Friction & Blindspots] |
| Fragmented alerts, noisy logs | Incompatible telemetry schemas | Manual verification scripts |
+----------------------------------+-----------------------------------+-----------------------------------+
| [Technical Enablement Layer] | [Technical Enablement Layer] | [Technical Enablement Layer] |
| Unified ingestion webhook | Correlated trace indexing engine | Canary deployment controller |
+----------------------------------+-----------------------------------+-----------------------------------+
To build an actionable artifact, teams structure their mapping matrix across five distinct horizontal tiers. Each tier captures a specific depth of field, preventing conflation between human psychology and technical implementation details:
| Structural Tier | Primary Focus | Underlying Data Source | Architectural Impact |
|---|---|---|---|
| 1. Temporal Phases | Macro milestones in the user domain life cycle | Qualitative field research, ethnographic studies | Defines domain boundaries and service scopes |
| 2. User Actions & Mindset | Concrete tasks, human inquiries, and cognitive goals | User interviews, observational task analyses | Informs API contracts and workflow orchestration |
| 3. Sentimental Trajectory | Emotional valence, stress levels, and cognitive burden | CSAT surveys, sentiment analysis, UX-Lite scores | Highlights user friction zones requiring automated fallbacks |
| 4. System Friction Points | Cognitive hurdles, handoff latency, data loss | Drop-off analytics, support tickets, rage-click telemetry | Drives backlog prioritization and error recovery flows |
| 5. Opportunities & Tech Enablers | Targeted platform capabilities and architectural solutions | Engineering spikes, event pipelines, platform telemetry | Directly populates sprint planning and architectural roadmaps |
Maintaining clear boundaries between these tiers prevents engineering bias from contaminating discovery research. When technical teams jump directly to proposing architectural solutions without thoroughly recording the user emotional trajectory and cognitive friction, they systematically misdiagnose the underlying operational problem.
Taxonomy Breakdown: Customer Experience Map vs Customer Journey Map
Product and engineering teams frequently conflate discovery artifacts, treating experience maps, journey maps, blueprints, and empathy models as interchangeable deliverables. This conceptual blur introduces significant delivery risk. Designing backend services against an ill-defined artifact leads to scope creep or fragile architectures optimized for imaginary workflows. Resolving the debate of customer experience map vs customer journey map requires evaluating the scope, temporal horizon, and vendor specificity of each artifact.
A customer experience map analyzes human behavior and goals across an entire domain agnostic of any single vendor or product. In contrast, a customer journey map investigates a user chronological path and touchpoints interacting with a specific product, service, or brand touchpoint. The distinction dictates the design decisions an engineering organization can reliably derive from the document.
| Evaluation Dimension | Customer Experience Map | Customer Journey Map | Service Blueprint | Empathy Map |
|---|---|---|---|---|
| Scope | Holistic human problem domain | Discrete product or service lifecycle | Internal technical and operational execution | Individual cognitive persona |
| Vendor Specificity | Vendor-agnostic | Proprietary product-specific | Proprietary system-specific | Persona-specific |
| Temporal Depth | Long term, non-linear lifecycles | Linear, touchpoint-driven paths | Synchronous execution timelines | Static, moment-in-time snapshot |
| Primary Touchpoints | Cross-ecosystem human actions | Application screens, emails, checkout flows | Microservices, queues, internal databases | Internal feelings, perceived statements |
| Telemetry Integration | Macro domain benchmarks, external logs | Event buses, analytics tracking, funnel metrics | APM distributed tracing, RPC latency, SLOs | Qualitative transcripts, survey scores |
| Primary Consumer | Product strategists, system architects | UX designers, frontend product teams | Platform engineers, DevOps, SREs | User researchers, content designers |
| Lifespan | Years (shifts only with domain changes) | Quarters (shifts with UI/feature updates) | Months (shifts with backend topology) | Stable until demographic shifts |
| Failure Mode | Too abstract to yield engineering tickets | Misses offline or competitive touchpoints | Ignores user emotional state entirely | Fails to capture sequential workflows |
Artifact Selection Checklist
- Use an experience map when entering greenfield product domains, architecting multi-product ecosystem boundaries, or modernizing legacy monoliths.
- Use a customer journey map when optimizing conversion funnels, eliminating screen-level drop-offs, or revamping user onboarding within an existing proprietary app.
- Use a service blueprint when connecting customer-facing journey steps directly to backend microservices, third-party APIs, and asynchronous message brokers.
- Use an empathy map during early stakeholder alignment to ground developers and product managers in the psychological baseline of a single persona.
Modern Experience Mapping and Design Workflows
Translating qualitative user research into resilient software requires a formalized protocol. High-performing engineering organizations execute experience mapping and design not as an isolated artistic workshop, but as an empirical research and modeling pipeline. By treating user friction as an architectural defect, cross-functional squads systematically extract systemic insights and convert them directly into actionable engineering backlogs.
Methodological Imperative: Triangulate every qualitative observation with quantitative platform telemetry. Never let subjective stakeholder assumptions dictate journey node definitions without empirical verification.
Step-by-Step Experience Mapping Protocol
- Empirical Discovery and Ethnography: Gather unmoderated session replays, diary studies, and contextual inquiry recordings across real practitioners executing work in their native environments. Document every platform, analogue process, and workaround they employ to achieve their objectives.
- Domain Entity and Workflow Modeling: Isolate universal operational goals from transient tooling choices. Identify the core transactional entities, decision gates, and regulatory boundaries that dictate the human process across the domain.
- Friction and Stress Identification: Mark every phase where users exhibit elevated cognitive strain, context switching, or manual data transformation. Calculate the temporal lag introduced by human intermediation between disconnected systems.
- System Capability Mapping: Align every identified friction node with target system capabilities, evaluating whether latency reduction, automated event routing, or data unification resolves the underlying cognitive load.
- Backlog Ingestion and Prioritization: Convert validated experience opportunities into engineering epics, tagging each user story with measurable friction indices such as Customer Effort Score (CES) and task completion time.
Executing experience mapping and design through this disciplined protocol ensures that design deliverables align with system requirements. Rather than handing engineers a visual design that hides domain complexities, the team produces an operational map that guides database schema design, message bus event definitions, and transactional boundary demarcation.
Instrumenting the Map: Binding Telemetry, Latency, and Metrics to Emotional Trajectories
The core vulnerability of legacy user experience mapping lies in subjectivity. When emotional curves are drawn purely from designer intuition, engineering teams struggle to prioritize them against concrete operational outages. Modern systems bridge this gap by instrumenting user sentiment directly to client-side performance, telemetry pipelines, and Application Performance Monitoring (APM) thresholds.
By treating negative human emotion as the behavioral symptom of system friction, teams can construct deterministic correlations between API performance, microservice response degradation, and drop-off rates:
| Journey Phase | Human Emotional State | Target UX Metric | Correlated Telemetry Event | Engineering SLO / Latency Threshold |
|---|---|---|---|---|
| 1. Discovery / Ingestion | Overwhelmed, Skeptical | UX-Lite Usability > 80 | catalog_search_executed |
p95 search latency < 250ms |
| 2. Configuration | High Stress, Detail-Focused | Customer Effort Score (CES) < 2.0 | config_validation_error |
Client error rate < 0.5% |
| 3. Execution / In-Flight | Anxious, Passive Waiting | System Perceived Wait Index | job_dispatched_to_queue |
Queue time-to-first-event < 1200ms |
| 4. Triage / Error State | Frustrated, Panicked | Recovery Success Rate > 95% | remediation_action_failed |
Error recovery cycle < 30s |
| 5. Completion / Retrospective | Relieved, Satisfied | CSAT > 4.5 / 5.0 | report_generated_successfully |
Full transaction batch duration < 5s |
To record these interactions reliably without introducing frontend performance degradation, telemetry events must capture operational state, user context, and sentiment markers through a structured event payload:
import { TelemetryClient } from "@enterprise/telemetry-sdk" // Version 4.12.0 for 2026 pipelines

interface ExperienceMapTelemetryPayload {
 mapId: string;
 journeyPhase: "discovery" | "configuration" | "execution" | "triage" | "completion"
 emotionalTargetValence: number; // Normalized scale: -1.0 (extreme distress) to +1.0 (delight)
 interactionLatencyMs: number;
 cesScoreEstimate: number;
 context: {
 userId: string;
 workspaceId: string;
 activeErrorsCount: number;
 retryAttempts: number;
 };
}

export class ExperienceTelemetryManager {
 private client: TelemetryClient;

 constructor(client: TelemetryClient) {
 this.client = client;
 }

 public trackPhaseFriction(payload: ExperienceMapTelemetryPayload): void {
 try {
 if (payload.interactionLatencyMs > 1200 || payload.context.retryAttempts > 2) {
 // Flag an experience anomaly when system latency threatens user psychological safety
 payload.emotionalTargetValence = Math.max(-1.0, payload.emotionalTargetValence - 0.5);
 }

 this.client.emit("experience_map.phase_evaluated" {
 timestamp: new Date().toISOString(),
.payload,
 });
 } catch (error) {
 console.error("Failed to dispatch experience telemetry event:" error);
 }
 }
}
Instrumenting your telemetry pipeline against experience phases transforms your map from a historical design presentation into an operational monitor. When a downstream microservice suffers database contention and pushes p99 latency beyond acceptable limits, product managers can immediately observe the corresponding plunge in the map sentimental trajectory in production.
Machine-Readable Experience Mapping: An Open JSON Schema Blueprint
A persistent failure mode of traditional design artifacts is their format: static canvas files locked within proprietary design suites that decay the moment a code branch merges. To institutionalize an experience map across continuous delivery lifecycles, teams must define the map through declarative, machine-readable schemas maintained in version control alongside application source code.
The following production JSON schema defines an authoritative, GitOps-compatible structure for encoding stages, user mindsets, touchpoint networks, pain points, and technical instrumentation hooks:
{
 "$schema" "https://json-schema.org/draft/2020-12/schema"
 "title" "UserExperienceMapSchema"
 "type" "object"
 "required" ["mapMetadata" "domain" "phases"],
 "properties" {
 "mapMetadata" {
 "type" "object"
 "required" ["mapId" "version" "lastUpdatedIso" "ownerTeam"],
 "properties" {
 "mapId" { "type" "string" },
 "version" { "type" "string" },
 "lastUpdatedIso" { "type" "string" "format" "date-time" },
 "ownerTeam" { "type" "string" }
 }
 },
 "domain" { "type" "string" },
 "phases" {
 "type" "array"
 "items" {
 "type" "object"
 "required" ["phaseId" "phaseTitle" "humanIntent" "steps"],
 "properties" {
 "phaseId" { "type" "string" },
 "phaseTitle" { "type" "string" },
 "humanIntent" { "type" "string" },
 "steps" {
 "type" "array"
 "items" {
 "type" "object"
 "required" ["stepId" "action" "sentimentValence" "telemetryHook"],
 "properties" {
 "stepId" { "type" "string" },
 "action" { "type" "string" },
 "sentimentValence" { "type" "number" "minimum" -1.0, "maximum" 1.0 },
 "painPoints" {
 "type" "array"
 "items" { "type" "string" }
 },
 "telemetryHook" {
 "type" "object"
 "required" ["eventName" "slaLatencyThresholdMs"],
 "properties" {
 "eventName" { "type" "string" },
 "slaLatencyThresholdMs" { "type" "number" }
 }
 }
 }
 }
 }
 }
 }
 }
 }
}
Schema Integration Verification Checklist
- Store the mapping JSON schema in your central domain repository alongside your protobuf and OpenAPI specifications.
- Trigger continuous integration checks to validate that newly declared platform events correspond to active telemetry hooks in application microservices.
- Generate live documentation directly from the schema during release builds, ensuring internal knowledge portals reflect production changes.
- Audit human sentiment delta flags during pull request reviews to verify that architectural refactors do not increase step complexity.
Operationalizing Experience Maps to Prevent Agile Anti-Patterns
In fast-moving product organizations, user experience artifacts frequently suffer from the set-and-forget anti-pattern. A team invests significant capital in discovery research, visualizes an experience map, presents it to executive leadership, and immediately abandons it to manage an unaligned backlog of tactical bug fixes. Operationalizing an experience map requires embedding its structure into sprint planning, backlog grooming, and post-incident retrospectives.
Anti-Pattern Warning: If your product backlog contains tickets that cannot be traced to a specific cell, user action, or friction point on your experience map, your engineering team is building features that lack validated domain alignment.
To maintain architectural parity between product roadmaps and real human workflows, engineering leads and product owners enforce three operational disciplines across continuous deployment cadences:
1. Bi-Directional Backlog Traceability
Every epic ticket created in issue tracking platforms must reference a specific phaseId and stepId defined in your authoritative experience map schema. When engineers triage technical debt, they can immediately quantify the human operational cost of an unpatched defect by reviewing the affected user journey node.
2. Telemetry-Driven Map Drift Detection
User behaviors shift as platform features mature. By instrumenting automated data pipelines that monitor conversion drop-offs, application exit rates, and API error spikes, teams detect drift between observed production telemetry and mapped baseline behaviors. When telemetry indicates that 40% of users take an undocumented detour around a specific workflow phase, the experience map is flagged for iterative re-discovery.
3. Incident Retrospectives Linked to Sentiment Trajectories
Standard engineering post-mortems analyze Mean Time to Recovery (MTTR), service mesh outages, and database failovers. High-maturity organizations extend this practice by conducting experience impact audits. During an outage, the incident response team maps the blast radius directly to user psychological states across the experience map, identifying where catastrophic data loss or missing status transparency turned mild user frustration into platform abandonment.
Operational Hygiene Checklist
- Audit experience map JSON schemas every quarter to incorporate findings from ongoing user interviews and telemetry baselines.
- Require explicit references to experience map friction indices in engineering Requests for Comments (RFCs) and architectural review documents.
- Review telemetry drift reports during sprint planning to ensure backlogs prioritize high-friction human bottlenecks over speculative feature requests.
Frequently Asked Questions
What is the core difference in customer experience map vs customer journey map?
A customer experience map analyzes human behavior and goals across an entire domain agnostic of any single vendor or product. In contrast, a customer journey map investigates a user chronological path and touchpoints interacting with a specific product, service, or brand touchpoint.
How do experience mapping and design integrate into continuous delivery?
Experience mapping and design integrate into continuous delivery by linking journey stages directly to telemetry signals, event triggers, and backlog epics. Teams update the map continuously as production telemetry reveals emerging operational friction across microservices.
What key layers must be included in a user experience map?
A complete user experience map contains five core horizontal bands: user temporal phases, concrete actions and mindsets, emotional sentiment trajectories, systemic friction points, and architectural opportunities mapped to technical capabilities.
Can you define experience mapping in a technical product discovery context?
In technical discovery, an experience map documents the agnostic end-to-end human workflow to expose unserved needs. Engineers use this baseline to identify architecture boundaries, system dependencies, and telemetry requirements prior to drafting service blueprints or technical specifications.
Building an effective user experience map requires bridging human psychology, product discovery, and systems architecture. By shifting from ephemeral design canvases to version-controlled, telemetry-instrumented experience maps, teams eliminate the historic divide between subjective user research and objective engineering execution. The resulting maps serve not merely as illustrative graphics, but as structural foundations for domain-driven service boundaries, resilient error-recovery flows, and metrics-driven sprint planning.
As distributed architectures grow in complexity, the organizations that succeed will be those that ground their technical roadmaps in empirical human workflows. By adopting a declarative schema, connecting telemetry pipelines directly to sentiment trajectories, and enforcing bidirectional traceability into engineering backlogs, your team can construct software systems that achieve both operational excellence and lasting user trust.