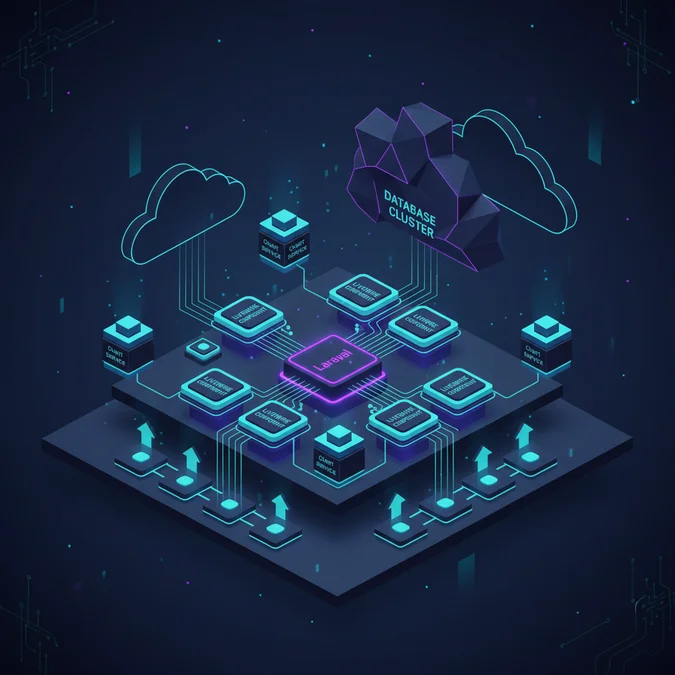

Laravel Livewire charts bridge server-side PHP data pipelines and browser-based vector visualization libraries like Chart.js or ApexCharts without requiring a separate single-page application framework. By pairing Livewire reactive state management with client-side JavaScript bridges using Alpine.js or custom event dispatchers, teams render performant, dynamic dashboards that update automatically when backend models mutate.
Engineering teams frequently encounter critical performance degradation when rendering real-time data visualizers within server-driven UI architectures. The naive approach of passing unbounded Eloquent collections directly into Livewire component properties causes massive payload bloat, network latency over WebSockets or HTTP polls, and complete canvas destruction cycles on every re-render.
Building sustainable metrics interfaces requires strict architectural boundaries between data ingestion, analytical aggregation, payload serialization, and DOM mounting. This guide examines how to structure high-throughput analytics pipelines, isolate rendering layers, optimize client-side lifecycle hooks, and maintain rock-solid cloud infrastructure under heavy visualization workloads.
Core Mechanics: Bridging Livewire Reactivity with Canvas Visualizations
Laravel Livewire charts function by synchronizing backend PHP state with browser visualization engines through Alpine.js or native custom events, avoiding full page reloads while maintaining server authority over data modeling. The fundamental architectural challenge lies in the DOM reconciliation loop: when a Livewire component hydrates, processes mutations, and pushes fresh HTML down the wire, standard Morphdom algorithms attempt to overwrite existing canvas elements, destroying active WebGL or Canvas rendering contexts.
To prevent canvas tearing and expensive re-initializations, the rendering layer must enforce DOM isolation. Livewire provides the wire:ignore directive, instructing the client-side morph engine to bypass designated container nodes during reconciliation sweeps. Below is the operational lifecycle flow governing this state boundary:
- Server Ingestion: The Livewire component executes SQL aggregations, structures series arrays, and updates internal component state.
- Event Transmission: Rather than sending raw markup changes to the graph container, the component emits a targeted browser event containing only updated numeric vectors.
- Client Interception: An Alpine.js wrapper or vanilla event listener catches the payload without triggering a structural DOM diff.
- Canvas Mutation: The JavaScript library invokes internal update methods (such as
chart.update()) to interpolate vector trajectories natively on the client graphics layer.
Adhering to this lifecycle eliminates client-side frame drops and preserves interactive canvas states such as zoom levels and active tooltips across frequent polling intervals.
Selecting the Right Visualization Engine: Chart.js vs ApexCharts vs ECharts
Choosing an appropriate rendering library determines client-side resource utilization, canvas responsiveness, and bundle delivery footprints. While developers frequently gravitate toward superficial design aesthetics, system architects must evaluate memory consumption per series point, rendering tech (Canvas vs SVG), and event listener memory management under continuous WebSocket or polling updates.
ApexCharts provides out-of-the-box responsive designs and smooth tween animations, but its internal dependency tree produces a significantly larger bundle size. Chart.js operates on an HTML5 canvas layer, ensuring exceptional frames-per-second performance for medium-density data arrays while keeping application asset weights minimal. Apache ECharts leverages a hybrid canvas/SVG rendering engine capable of handling millions of data points, making it the industry standard for dense telemetry, IoT tracking, and massive timeseries exploration.
| Engine | Rendering Technology | Bundle Size (Gzipped) | Max Recommended Data Points | Best Suited Operational Tier |
|---|---|---|---|---|
| Chart.js | HTML5 Canvas | ~65 KB | 10,000 to 50,000 | Standard SaaS metrics, KPI cards, activity trackers |
| ApexCharts | SVG / Hybrid | ~135 KB | 5,000 to 15,000 | Executive reporting, polished responsive layouts |
| Apache ECharts | Canvas / SVG / WebGL | ~300 KB | 100,000 to 1,000,000+ | High-frequency telemetry, industrial IoT, market data |
When orchestrating high-density visualizers, coupling Livewire with a lightweight canvas engine prevents main-thread execution lockups during complex animation cycles.
Component Implementation: Building a Resilient Livewire and Chart.js Bridge
A production-ready Livewire chart component decouples dataset aggregation from the structural presentation layer. By isolating the canvas element within an Alpine component and marking its parent with wire:ignore, changes to adjacent controls like date pickers do not force canvas destructions.
The backend component should handle parameterized querying, date bounds validation, and structured output formatting. Adopting clean patterns from application-based modern software architecture ensures database queries stay strictly separated from Livewire view rendering loops.
<php

namespace App\Livewire\Metrics;

use Livewire\Component;
use App\Services\AnalyticsAggregator;
use Illuminate\Support\Carbon;

class RevenueMetricsChart extends Component
{
 public string $period = '7d';
 public array $chartData = [];

 public function mount(AnalyticsAggregator $aggregator): void
 {
 $this->loadChartData($aggregator);
 }

 public function updatedPeriod(AnalyticsAggregator $aggregator): void
 {
 $this->loadChartData($aggregator);
 // Dispatch browser event to push new vector metrics directly to client
 $this->dispatch('chart-data-updated', series: $this->chartData);
 }

 protected function loadChartData(AnalyticsAggregator $aggregator): void
 {
 $this->chartData = $aggregator->getRevenueBuckets($this->period);
 }

 public function render()
 {
 return view('livewire.metrics.revenue-chart');
 }
}
The corresponding Blade view integrates Alpine.js to manage the client canvas lifecycle without third-party wrapper libraries:
<div class="p-4 bg-white rounded-lg shadow">
 <div class="flex justify-between items-center mb-4">
 <h3 class="text-lg font-medium text-gray-900">Revenue Velocity</h3>
 <select wire:model.live="period" class="text-sm rounded border-gray-300">
 <option value="24h">Last 24 Hours</option>
 <option value="7d">Last 7 Days</option>
 <option value="30d">Last 30 Days</option>
 </select>
 </div>

 <-- wire:ignore stops Livewire morphdom from tearing down the canvas -->
 <div
 wire:ignore
 x-data="{
 chartInstance: null,
 init() {
 const ctx = this.$refs.canvas.getContext('2d');
 this.chartInstance = new Chart(ctx, {
 type: 'line',
 data: {
 labels: @js($chartData['labels']),
 datasets: [{
 label: 'Gross Volume',
 data: @js($chartData['values']),
 borderColor: '#4f46e5',
 tension: 0.1
 }]
 },
 options: {
 responsive: true,
 maintainAspectRatio: false
 }
 });

 window.addEventListener('chart-data-updated', (e) => {
 this.chartInstance.data.labels = e.detail.series.labels;
 this.chartInstance.data.datasets[0].data = e.detail.series.values;
 this.chartInstance.update();
 });
 }
 }"
 class="relative h-72 w-full"
 >
 <canvas x-ref="canvas"></canvas>
 </div>
</div>
Payload Serialization and Network Latency Engineering
Network overhead is the silent killer of responsive Livewire charts. When an engineer assigns an Eloquent Collection containing thousands of hydratable model entities to a public Livewire component property, Livewire serializes the entire entity graph into encrypted snapshots sent with every network ping. This causes massive request payloads, CPU-heavy cryptographic operations, and unacceptably sluggish interactions.
To guarantee minimal roundtrip time (RTT), public component properties must contain only bare primitive scalar arrays or pre-serialized JSON objects. The following rules must govern backend payload preparation:
- Column Stripping: Never pass full records. Extract only the timestamp axis and numeric value axis using database projection (e.g.
selectRaw('DATE(created_at) as date, SUM(amount) as total')). - Temporal Downsampling: If querying millions of operational records, aggregate continuous data into discreet intervals (such as 5-minute or 1-hour buckets) at the database layer rather than transmitting raw event timestamps to PHP memory.
- Payload Quantization: Format floating-point values to defined decimal points (e.g.
round($val, 2)) before transmission, reducing serialized string footprint across network links.
Compressing data transport ensures payload sizes stay beneath 15 KB even across high-resolution, multi-series dashboards, minimizing transit delay over variable mobile networks.
Real-Time Telemetry: Polling Strategies vs WebSocket Push
Dynamic dashboard applications demand continuous visual refreshes. Developers typically choose between HTTP-based interval polling via Livewire wire:poll or push-based WebSocket connections using Laravel Reverb, Pusher, or self-hosted Soketi clusters. The trade-offs involve infrastructure complexity, load balancer concurrency, and database query frequency.
Simple environments benefit from wire:poll.10s, which requests component re-renders on a set cadence. However, under high concurrency, this generates an avalanche of uncoordinated read traffic against backend databases, degrading overall web tier availability.
| Architecture Dimension | Livewire wire:poll | WebSocket Push (Laravel Reverb) |
|---|---|---|
| Protocol Overhead | Full HTTP handshake and session parsing on every cycle | Single persistent TCP handshake with lightweight frames |
| Database Contention | Periodic reads trigger on every client regardless of data changes | Zero database load until state transitions trigger an event |
| Infrastructure Demands | Standard PHP-FPM workers, horizontal scale via ALB | Dedicated stateful socket servers, redis pub/sub backend |
| Concurrency Ceiling | Constrained by PHP thread pools under heavy volume | Tens of thousands of active socket listeners per instance |
| Implementation Cost | Trivial (single Blade attribute) | Requires queue workers, broadcast auth, socket management |
For systems handling over 500 concurrent administrative sessions, routing real-time telemetry updates through WebSockets avoids exhausting web tier connection pools.
Database Aggregation Architecture: Avoiding the N+1 Visualization Trap
A visualization interface is only as robust as its backing queries. Executing complex analytical aggregations inside synchronous web requests introduces catastrophic latency bottlenecks. When multiple users access analytical dashboard components simultaneously, running unbounded table scans or looping over relation sets creates severe I/O bottlenecks across relational databases.
Instead of recalculating metrics synchronously within Livewire components, offload time-series generation onto pre-computed rollups or asynchronous queue jobs. Applying a resilient asynchronous background queue architecture ensures analytical write workloads never interfere with immediate HTTP response threads.
Implementing Database Read Replicas and Materialized Views
Analytical reporting queries should target dedicated read replicas rather than the primary transactional database instance. Furthermore, teams operating on PostgreSQL or MySQL 8+ should use materialized views or scheduled continuous aggregation tables:
-- PostgreSQL Continuous Aggregate Pattern
CREATE MATERIALIZED VIEW hourly_sales_summary AS
SELECT
 date_trunc('hour', created_at) AS metric_hour,
 status,
 COUNT(id) AS total_orders,
 SUM(total_cents) AS gross_revenue
FROM orders
GROUP BY 1, 2
WITH DATA;

CREATE UNIQUE INDEX ON hourly_sales_summary (metric_hour, status);
Your Livewire component queries this dense materialized table via an automated caching layer, pulling months of metrics within single-digit milliseconds:
public function getMetricDataProperty(): array
{
 return Cache:remember('metrics:hourly_revenue', 300, function () {
 return DB:table('hourly_sales_summary')
 ->where('metric_hour', '>=', now()->subDays(7))
 ->orderBy('metric_hour', 'asc')
 ->get(['metric_hour', 'gross_revenue'])
 ->toArray();
 });
}
Client-Side Lifecycle Management and Memory Leaks
Dynamic front-ends that continually update visual elements can suffer from hidden JavaScript memory leaks. Every time a chart canvas initializes, it allocates internal render buffers, vector coordinate arrays, and window resize listeners. If a Livewire component triggers a full DOM rebuild without tearing down old chart instances, orphaned memory fragments accumulate on the user browser tab.
Preventing memory inflation requires strict component lifecycle cleanup. Alpine.js provides the $cleanup lifecycle helper, ensuring developers destroy existing chart instances whenever parent elements unmount or swap during live updates.
// Complete teardown sequence within Alpine initialization context
init() {
 const canvas = this.$refs.canvas;
 const chart = new Chart(canvas, config);

 // Register cleanup hook to detach resize observers and free buffers
 this.$cleanup(() => {
 if (chart) {
 chart.destroy();
 }
 });
}
Failure to invoke chart.destroy() leaves detached DOM nodes and window-bound resize listeners active in browser heap memory. Over extended operational sessions on control room dashboards, this causes browser tab crashes and unhandled context loss errors.
Multi-Tenant Metrics Isolation and Security Guardrails
When rendering analytical dashboards across enterprise multi-tenant SaaS platforms, safeguarding data boundaries is a non-negotiable architectural requirement. Because charting components often expose interactive controls for date ranges, aggregation steps, and metric dimensions, malicious users can attempt parameter tampering to infer or access adjacent tenant data.
Never accept raw SQL parameters or table dimensions directly from client Livewire properties. Every incoming update parameter must pass through strict schema validation and explicit tenant scoping:
- Scoped Eloquent Querying: Apply Global Scopes or explicit workspace ownership checks to every aggregate query (e.g.
Order:query()->where('tenant_id', auth()->user()->tenant_id)). - Metric Dimension Whitelisting: Validate grouping columns against a hardcoded enum or immutable array rather than dynamically injecting strings into database aggregation clauses.
- Preventing Time-based Side-Channel Leaks: Normalize query latency using caching strategies so that timing differentials do not expose confidential volume indicators to unauthorized actors.
By enforcing tenant validation in backend service layers, your visualizers remain completely insulated from cross-tenant data leaks.
Infrastructure Scaling: Cloud Provisioning for High-Volume Visualizers
Deploying interactive Livewire dashboards at scale presents unique load profiles. Unlike standard brochure sites or simple transactional CRUD applications, metric dashboards generate rapid bursts of dynamic requests, prolonged HTTP connections via polling, or thousands of concurrent WebSocket channels.
Architecting an enterprise infrastructure tier requires elastic horizontal scaling and strict separation of transactional traffic from visualization workloads.
AWS Architecture Baseline
A production environment supporting heavy Livewire visualization traffic typically runs on AWS using these core resources:
- Compute Layer (Amazon ECS Fargate): Auto-scaling container fleets hosting Laravel web workers, scaled according to CPU utilization and ALB target response latency metrics.
- Analytical Cache Tier (Amazon ElastiCache Redis): Dedicated memory clusters to ingest pre-calculated metrics and decouple active Livewire polling requests from transactional databases.
- Managed Database Cluster (Amazon Aurora PostgreSQL/MySQL): Configured with an analytical read replica endpoint, dedicated strictly to serving metric queries.
- Real-time Broadcast Engine (Laravel Reverb on AWS ECS or AWS API Gateway WebSockets): Dedicated stateful listeners handling live chart event broadcasting without consuming standard PHP-FPM web execution threads.
Segregating analytical reads from core database writes ensures high visualization traffic never degrades mission-critical transaction flows.
Cost Analysis and Engineering Economics of Dashboard Platforms
Constructing high-throughput metrics and dashboard systems demands careful capacity budgeting. Engineering leadership must analyze both software build costs and recurring cloud infrastructure outlays to determine whether to build custom Livewire charting modules or rely on pre-packaged commercial SaaS alternatives.
The overall financial commitment spans implementation labor, continuous integration testing, and long-term cloud compute resources for handling analytical queries.
| Engagement / Resource Tier | Standard Project Scope | Hourly Rate Range | Fixed Contract Range | Estimated Monthly Retainer |
|---|---|---|---|---|
| Senior Systems Architect | Pipeline architecture, replica isolation, payload design | $150 – $250 / hr | $15,000 – $35,000 | $6,000 – $12,000 / mo |
| Full-Stack Laravel Engineer | Livewire component code, Alpine bridge, UI implementation | $90 – $160 / hr | $8,000 – $20,000 | $4,500 – $8,000 / mo |
| Dedicated Infrastructure DevOps | Redis cluster, ECS autoscaling, multi-tenant read replicas | $130 – $220 / hr | $10,000 – $25,000 | $5,000 – $10,000 / mo |
In addition to development labor, cloud infrastructure costs fluctuate based on database I/O, cache size, and data transit. The table below illustrates typical monthly infrastructure costs for small to enterprise dashboard deployments:
| Operational Scale | Active Concurrent Users | Monthly AWS/GCP Cost | Primary Cost Drivers |
|---|---|---|---|
| Early Stage SaaS | 1 – 50 concurrent | $180 – $450 / mo | Single Aurora instance, small ElastiCache Redis node |
| Growth Tier | 50 – 500 concurrent | $850 – $2,200 / mo | Read replicas, horizontal ECS web containers, Reverb cluster |
| Enterprise Fleet | 500 – 5,000+ concurrent | $4,000 – $12,500 / mo | Multi-AZ read replicas, high-memory Redis caches, CloudFront ingress |
Teams building custom tracking suites should review frameworks in our guide to bespoke enterprise application development to budget their build phases realistically.
Testing and Automated Validation for Dynamic Chart Components
Validating reactive chart components requires testing both the PHP data aggregation pipelines and the frontend event emission flows. Standard HTTP unit tests are insufficient to confirm that components push structurally correct vector arrays down the wire without syntax errors.
Testing strategies must separate analytical query correctness from Livewire event dispatch verification. Below is an automated test pattern using Pest PHP:
<php

use App\Livewire\Metrics\RevenueMetricsChart;
use App\Services\AnalyticsAggregator;
use Livewire\Livewire;

it('calculates valid dataset buckets and dispatches browser updates', function () {
 // Arrange: Mock or build known historical transactions
 $this->seed(HistoricalTransactionsSeeder:class);

 // Act & Assert: Mount component and verify baseline state
 Livewire:test(RevenueMetricsChart:class)
 ->assertSet('period', '7d')
 ->assertViewHas('chartData', function ($data) {
 return count($data['labels']) === 7
 && isset($data['values'])
 && is_numeric($data['values'][0]);
 })
 // Mutate component property and verify correct event dispatch
 ->set('period', '30d')
 ->assertDispatched('chart-data-updated', function ($event, $params) {
 $series = $params['series'];
 return count($series['labels']) === 30
 && is_array($series['values']);
 });
});
For the browser presentation layer, implement end-to-end integration tests using Laravel Dusk or Playwright. These confirm that canvas elements mount properly, listen to dispatched window events, and adjust heights without causing browser console exceptions.
Troubleshooting Common Edge Cases in Livewire Charting
When integrating reactive state engines with third-party canvas libraries, subtle execution race conditions can surface in staging and production environments. Systematic debugging starts by identifying the exact failure mode across the network, DOM, or JavaScript runtime layers.
- Canvas Disappears After Livewire Update: The chart container is missing the
wire:ignoredirective. During the DOM reconciliation cycle, Livewire replaces the initialized canvas node with fresh markup, destroying the active rendering context. Wrap the canvas element or its direct parent container in awire:ignoreattribute. - Chart Does Not Resize on Window Breakpoint Changes: Canvas elements embedded inside dynamic CSS flex or grid containers require explicit size boundaries. Set
position: relative, define a fixed height (e.g.h-72), and passmaintainAspectRatio: falsein your library options. - Double Event Binding During Polling: When events are registered using global listeners like
window.addEventListenerwithout proper unbinding, each component re-render stacks duplicate callbacks, triggering multiple canvas redraws. Encapsulate listeners inside Alpine.js lifecycle blocks or explicitly clean up handlers usingremoveEventListener.
Addressing these boundary conditions early prevents hard-to-reproduce visual bugs across diverse client devices.
Architectural Hub and Foundational Learning Paths
Designing high-performance metric pipelines is an advanced skill that builds on fundamental framework primitives. Before implementing custom analytics engines, system architects should master underlying request lifecycles, database query optimization, and frontend state synchronization.
Explore our complete Laravel, Basics directory for more guides.
Reviewing our broader architectural playbooks will help your team standardize state boundaries, improve component caching, and scale production systems sustainably.
Factors That Affect Development Cost
- Aggregation pipeline complexity and database load requirements
- Target concurrency and real-time push mechanism (Polling vs WebSockets)
- High availability infrastructure (Multi-AZ read replicas, Redis memory tiers)
- Third-party charting license requirements (commercial enterprise suites)
Custom enterprise analytics systems built on Laravel and Livewire typically require an initial development investment between $15,000 and $45,000, accompanied by ongoing cloud infrastructure fees ranging from $200 to $3,500 per month depending on concurrency and throughput.
Frequently Asked Questions
Why does Livewire destroy my chart canvas whenever component state changes?
Livewire uses a DOM-morphing engine that reconciles client-side elements with new server-rendered HTML. Without isolation, this process replaces existing canvas elements, destroying active WebGL or 2D rendering contexts. Adding the wire:ignore directive to the chart container instructs Livewire to skip DOM diffing for that tree.
Should I use wire:poll or WebSockets for live charts?
Use wire:poll for low-concurrency dashboards or metrics updating at infrequent intervals (every 30 to 60 seconds). For real-time monitoring with multiple concurrent users, choose WebSockets (such as Laravel Reverb) to push lightweight event payloads without overwhelming your web servers with full HTTP cycles.
How do I prevent large datasets from slowing down Livewire?
Never assign raw Eloquent collections containing thousands of models to public Livewire properties. Aggregate and downsample metrics in the database, calculate rolling intervals, and pass only compact numeric arrays or JSON strings to browser visualization engines.
What is the best charting library to pair with Laravel Livewire?
Chart.js is optimal for standard web dashboards due to its small footprint and canvas performance. ApexCharts offers richer prebuilt responsive templates at the cost of bundle size. For extreme density (over 50,000 continuous data points), Apache ECharts provides the most resilient WebGL/canvas engine.
Building resilient, high-performance Laravel Livewire charts requires balancing server-side domain integrity with client-side canvas lifecycle isolation. By isolating DOM modifications via wire:ignore, offloading dataset delivery to custom browser events, and pre-aggregating metrics behind read replicas and Redis caches, development teams can build ultra-responsive dashboards without taking on the complexity of standalone single-page applications.
When scaling these systems, avoid treating metric visualizers as standard web components. Profile your network serialization payloads, decouple analytical queries from transaction databases, and structure clear architectural boundaries. Adopting these infrastructure standards ensures your analytics platforms scale smoothly as user concurrency and metric volumes grow.