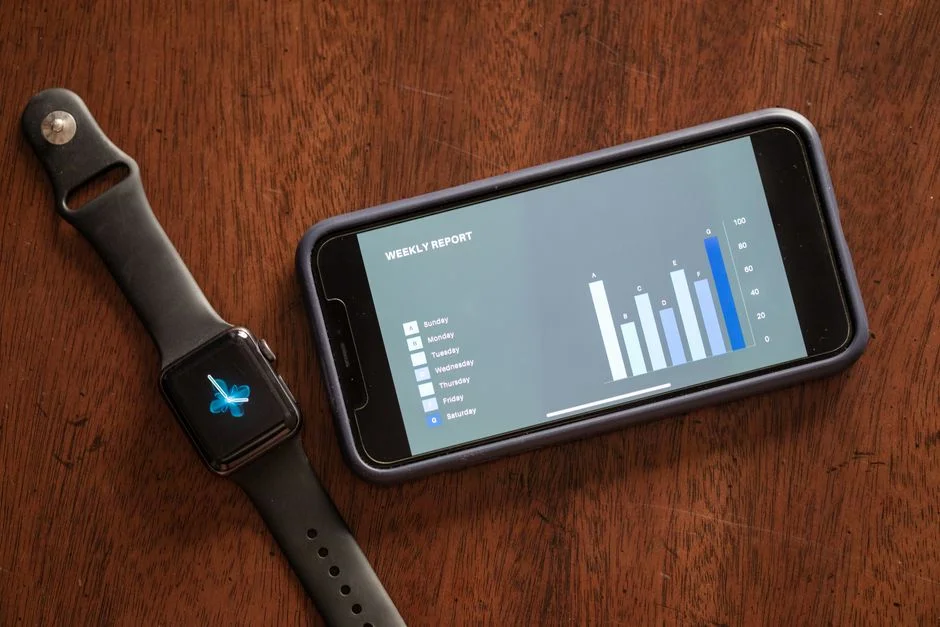

React Native charts are essential components for visualizing data in cross-platform mobile applications, enabling users to quickly interpret complex datasets through graphical representations. However, their implementation introduces a significant attack surface, demanding rigorous security considerations to prevent data breaches, unauthorized access, and compliance violations. A recent survey by the Open Web Application Security Project (OWASP) highlighted that client-side rendering frameworks, including those used in React Native, frequently expose applications to vulnerabilities like insecure data storage and improper input validation, especially when integrating third-party components for data visualization.
While the immediate goal of integrating charts is often enhanced user experience and data comprehension, a Security Engineer’s primary concern shifts to the integrity and confidentiality of the data being displayed. Improperly secured charts can inadvertently expose sensitive personal information (SPI), financial data, or proprietary business metrics, leading to severe reputational damage, regulatory fines, and loss of user trust. This article will dissect the security implications of using React Native charts, providing a framework for secure implementation from data ingestion to client-side rendering.
Our focus will extend beyond basic functionality to encompass the entire lifecycle of data within a charting context, emphasizing secure design principles, defensive coding practices, and continuous vulnerability management. We will explore how to mitigate risks associated with data handling, transmission, client-side rendering, and the selection of third-party charting libraries, ensuring that your data visualizations remain informative without compromising security.
Understanding React Native Charts and Their Inherent Security Risks
React Native charts are UI components that render various graphical representations of data, such as bar charts, line charts, pie charts, and scatter plots, within a mobile application built with React Native. They are typically implemented using third-party libraries that abstract the complexities of drawing and animating these visualizations. The core functionality involves taking a dataset, processing it, and then rendering it onto a canvas or SVG surface within the app. This process, while beneficial for user experience, inherently expands the application’s attack surface, presenting several security challenges.
The primary risk lies in the **data itself**. If the data displayed in a chart is sensitive, its journey from source to screen must be meticulously secured. This includes data at rest on backend systems, data in transit over networks, and data handled on the client device. Insecure handling at any stage can lead to data leakage or unauthorized modification. For example, displaying unencrypted personally identifiable information (PII) in a chart, even temporarily, creates a vulnerability. Attackers could exploit client-side weaknesses or network interception to gain access to this data.
Another significant concern is **client-side data manipulation**. If a chart’s data is loaded and processed entirely on the client, malicious actors might attempt to tamper with the displayed data or the underlying data structure. This could involve manipulating the visual representation to mislead users, or, in more advanced scenarios, exploiting vulnerabilities in the charting library itself to inject malicious code or trigger unexpected behavior. A common attack vector here involves Cross-Site Scripting (XSS) if chart labels or dynamic inputs are not properly sanitized and encoded before rendering. While React Native’s JSX helps mitigate traditional XSS, vulnerabilities can still arise from improper use of `dangerouslySetInnerHTML` or when rendering untrusted content.
Furthermore, the reliance on **third-party charting libraries** introduces supply chain risks. These libraries, while offering rich features and ease of integration, are external dependencies that may contain their own vulnerabilities. An unpatched vulnerability in a popular charting library could be exploited to compromise applications that use it. A proactive security posture demands thorough vetting of chosen libraries, regular security audits, and continuous monitoring for common vulnerabilities and exposures (CVEs) affecting these dependencies. The concept of ‘shifting left’ security, where security considerations are integrated early in the development lifecycle, is paramount here. This involves evaluating the security track record of a library, its maintenance frequency, and the responsiveness of its maintainers to security reports.
Finally, the **performance and resource consumption** of charting libraries can indirectly impact security. Overly complex or poorly optimized charts might lead to application freezes or crashes, which, while not a direct security vulnerability, can be exploited in denial-of-service (DoS) attacks or make the application less resilient to other forms of attack by consuming critical system resources. From a security perspective, an application that is unstable or unresponsive is less able to defend itself or report security incidents effectively. Therefore, optimization is not just a performance concern but also a resilience and security concern.
Data Handling and Compliance for Sensitive Chart Data
The secure handling of data for React Native charts is non-negotiable, particularly when dealing with sensitive information. Regulatory frameworks such as GDPR, HIPAA, CCPA, and industry standards like PCI DSS impose strict requirements on how data is collected, processed, stored, and displayed. Failing to adhere to these mandates can result in substantial penalties and erosion of user trust. Therefore, a robust data governance strategy is crucial, beginning with data classification.
Before any data is fed into a charting component, it must be classified based on its sensitivity. **Personally Identifiable Information (PII)**, **Protected Health Information (PHI)**, and financial data require the highest levels of protection. For such data, the principle of **least privilege** must be applied rigorously. Only the absolute minimum necessary data should be fetched, processed, and displayed. This means avoiding the transmission of raw, sensitive identifiers if aggregated or anonymized data suffices for the visualization’s purpose. Techniques like **data anonymization** or **pseudonymization** should be employed at the source, ideally in the backend, before data ever reaches the client application. Anonymization removes identifying information entirely, while pseudonymization replaces it with artificial identifiers, making re-identification more difficult but not impossible without additional information.
Consider the data lifecycle: **data at rest**, **data in transit**, and **data in use**. For data at rest on backend servers, strong encryption (e.g., AES-256) is mandatory. Database encryption, file-system encryption, and secure key management are fundamental. For data in transit between the backend API and the React Native application, **HTTPS with TLS 1.2 or higher** is the baseline. Furthermore, **certificate pinning** should be implemented to prevent man-in-the-middle (MITM) attacks. This ensures that the application only communicates with a server presenting a specific, known certificate, preventing attackers from impersonating the legitimate API endpoint. Without certificate pinning, a compromised Certificate Authority or a sophisticated attacker could issue a fraudulent certificate, allowing them to intercept and decrypt traffic.
// Example of basic certificate pinning in a React Native app (simplified for illustration)import { isTrustedCertificate } from 'react-native-ssl-pinning'; // A common library for SSL pinningconst API_BASE_URL = 'https://api.yourdomain.com';const EXPECTED_CERT_HASH = 'sha256/your_expected_certificate_hash'; // Obtain this from your server's public key hashasync function fetchDataSecurely(endpoint: string) { try { // Check certificate before making the request const isPinned = await isTrustedCertificate(API_BASE_URL, EXPECTED_CERT_HASH); if (!isPinned) { throw new Error('SSL certificate pinning failed. Untrusted server.'); } const response = await fetch(`${API_BASE_URL}/${endpoint}`, { method: 'GET', headers: { 'Content-Type': 'application/json', 'Authorization': 'Bearer ' + await getAuthToken(), // Secure token retrieval }, }); if (!response.ok) { throw new Error(`HTTP error! status: ${response.status}`); } return await response.json(); } catch (error) { console.error('Secure data fetch failed:', error); // Implement robust error reporting without leaking sensitive details throw error; }}On the client side, **data in use** within the React Native application must be handled with extreme caution. Avoid storing sensitive chart data in insecure locations like `AsyncStorage` or unencrypted local files. If temporary client-side storage is absolutely necessary, it must be encrypted using platform-specific secure storage mechanisms (e.g., KeyChain for iOS, Android Keystore for Android). Even then, the exposure window should be minimized. Implementations should also consider the implications of screenshots or screen recordings on the client device. For highly sensitive data, policies might include disabling screenshots or blurring sensitive areas when the app is backgrounded.
Finally, ensure all data processing within the application, especially before rendering charts, is performed in memory where possible, and sensitive raw data is purged immediately after its purpose is served. Thorough logging and auditing of data access patterns, both on the backend and within the mobile application’s telemetry, can help detect anomalies and potential breaches. This proactive monitoring is a critical component of a comprehensive compliance strategy.
Client-Side Vulnerabilities in React Native Chart Implementations
Even with secure data transmission, the client-side implementation of React Native charts can introduce significant vulnerabilities if not handled correctly. Attackers often target the client application because it operates in an environment partially controlled by the user, offering different avenues for exploitation compared to hardened server infrastructure. Understanding these client-side risks is crucial for a Security Engineer.
One of the most pervasive client-side threats is **Cross-Site Scripting (XSS)**, even in React Native. While React Native’s JSX rendering engine inherently sanitizes content to prevent traditional browser-based XSS, vulnerabilities can still arise. This typically occurs when dynamic, untrusted content is directly inserted into the UI without proper encoding or sanitization, often via properties like `dangerouslySetInnerHTML` in web-based components embedded within React Native, or when rendering untrusted content into SVG or WebViews used by some charting libraries. If chart labels, tooltips, or data points are populated with user-supplied input that isn’t validated and escaped, a malicious script could be injected and executed, leading to session hijacking, data exfiltration, or defacement of the UI. Input validation and output encoding are fundamental defenses here. All data originating from external sources, whether user input or API responses, must be treated as untrusted and subjected to strict validation against expected formats and types, followed by appropriate encoding before rendering.
// Example: Sanitizing user input for chart labels (using a library like 'dompurify' or custom logic)import DOMPurify from 'dompurify'; // Note: DOMPurify is primarily for web, but concept applies to sanitizationconst sanitizeInput = (input: string) => { // For React Native, direct DOMPurify might not be applicable // Instead, focus on validating input against expected patterns // and escaping special characters if rendered in a WebView or specific contexts. // Example: Basic HTML entity encoding for display within text return input.replace(/&/g, '&') .replace(//g, '>') .replace(/"/g, '"') .replace(/'/g, ''');};function ChartComponent({ data, label }: { data: any[], label: string }) { const safeLabel = sanitizeInput(label); // Ensure all dynamic content is sanitized // Render chart with safeLabel return ( // ... chart rendering logic ... {safeLabel} // Render text content safely );};Another significant vulnerability is **insecure local storage**. While not directly a charting library issue, it’s a common pattern to cache chart data locally for offline access or faster loading. Storing sensitive chart data in `AsyncStorage`, `localStorage` (if using WebViews), or unencrypted files on the device filesystem makes it vulnerable to forensic analysis by attackers who gain physical access to the device or exploit other app vulnerabilities to read local files. As discussed, platform-specific secure storage solutions (KeyChain, Android Keystore) should be used for any sensitive data that must persist on the client, and even then, only encrypted data should be stored. The lifetime of such cached data should be minimized, and it should be purged upon user logout or app uninstallation.
Furthermore, **reverse engineering and tampering** are constant threats to client-side applications. Attackers can decompile React Native bundles to understand application logic, potentially discovering how charts process and display data. This could reveal API endpoints, data structures, or even hardcoded secrets if developers are not careful. Obfuscation and code minification can make reverse engineering more difficult, but they do not eliminate the threat. Critical security logic should ideally reside on the server. For sensitive client-side operations related to charts, such as specific data transformations or access controls, consider implementing **runtime application self-protection (RASP)** techniques or integrity checks to detect and react to tampering attempts. This might involve checking the integrity of the application bundle at runtime or monitoring for unauthorized debugging tools.
Finally, **denial of service (DoS)** attacks can be initiated client-side by feeding excessively large or malformed datasets into charting components, causing the application to crash or become unresponsive. While not directly a data breach, it impacts availability and user experience. Robust input validation and server-side pagination of data sent to the client can mitigate this. The client application should also have mechanisms to gracefully handle errors and unexpected data formats from the charting library without crashing, preventing a simple data anomaly from becoming a security incident.
Securing Data Transmission to React Native Charts
The journey of data from your backend systems to a React Native application’s charting component is a critical security pathway. Any compromise during this transmission can lead to data interception, alteration, or denial of service. A multi-layered approach to securing data in transit is essential, focusing on encryption, authentication, and integrity.
The foundational layer of secure data transmission is **Transport Layer Security (TLS)**, typically implemented via HTTPS. It is imperative that all API endpoints serving data to React Native charts use HTTPS exclusively, with strong cryptographic protocols (TLS 1.2 or higher) and robust cipher suites. Deprecated protocols like SSLv3 or TLS 1.0/1.1 must be disabled. This encrypts the communication channel, protecting data from passive eavesdropping and MITM attacks. However, relying solely on HTTPS is often insufficient for high-security applications, as a compromised Certificate Authority (CA) or a misconfigured network can still undermine its protection.
To enhance TLS security, **SSL/Certificate Pinning** is a critical mechanism. Certificate pinning involves embedding or ‘pinning’ the expected public key or certificate of your server within the client application. When the React Native app attempts to connect to your API, it verifies that the server’s presented certificate matches the pinned certificate. If there’s a mismatch, the connection is immediately terminated, preventing communication with a potentially malicious server impersonating your API. This significantly mitigates the risk of MITM attacks, even if a CA is compromised. Implementing certificate pinning requires careful management, as expired or changed certificates on the server side will necessitate an app update to avoid connection failures.
// Example: iOS Network Security Configuration (Info.plist) for App Transport Security (ATS) and pinningNSAppTransportSecurity NSExceptionDomains yourdomain.com NSIncludesSubdomains NSPinSecuredConnections NSRequiresCertificateTransparency NSExceptionAllowsInsecureHTTPLoads NSExceptionRequiresForwardSecrecy NSExceptionMinimumTLSVersion TLSv1.2 NSPublicKeys NSIncludesSubdomains NSPublicKeyHashes sha256/Base64EncodedHashOfYourPublicKey Beyond secure transport, **API authentication and authorization** are paramount. Data for charts should only be accessible by authenticated and authorized users. This typically involves using secure token-based authentication mechanisms such as **JSON Web Tokens (JWTs)** or OAuth 2.0. JWTs, when signed with a strong secret and transmitted over HTTPS, provide a stateless way to verify user identity and permissions. However, JWTs should be short-lived to minimize the window of opportunity for token compromise. Refresh tokens, if used, must be stored securely (e.g., in secure storage like KeyChain/Android Keystore) and invalidated upon logout or detection of suspicious activity. Authorization checks must be performed on the backend for every data request, ensuring that the authenticated user has the necessary permissions to access the specific dataset requested for the chart. Merely relying on client-side checks for data display is a critical security flaw.
Furthermore, **input validation and output encoding** are not just client-side concerns. Backend APIs must also rigorously validate all incoming requests, including parameters that might influence the data returned for charts. This prevents injection attacks (e.g., SQL injection if the backend directly constructs queries based on client input) and ensures that only well-formed, expected requests are processed. Similarly, the data sent back to the client should be properly encoded to prevent issues if the client-side rendering engine has vulnerabilities. This also includes ensuring that error messages or debug information sent from the API do not inadvertently leak sensitive backend details that could aid an attacker. A secure API design minimizes the information exposed in error responses and logs.
Finally, consider **rate limiting and API throttling** on your backend API endpoints that serve chart data. This protects against brute-force attacks on authentication, prevents resource exhaustion from excessive requests, and mitigates DoS attempts. By implementing these robust transmission security measures, you significantly reduce the risk of data compromise before it even reaches the React Native chart components.
Dependency Management and Supply Chain Security for Charting Libraries
Integrating third-party charting libraries into a React Native application significantly accelerates development but also introduces a critical vector for security vulnerabilities: the software supply chain. Every external dependency, from the charting library itself to its transitive dependencies, represents a potential entry point for malicious code or unpatched vulnerabilities. A Security Engineer must adopt a proactive and continuous approach to managing these risks.
The first step is **rigorous vetting of charting libraries** before integration. This involves more than just evaluating features and performance. Examine the library’s security track record: have there been past CVEs? How quickly were they addressed? Assess the maintainer’s activity: Is the project actively maintained? Are security patches released promptly? What is the community support like? A well-maintained, widely used, and transparent open-source project often has more eyes on it for security issues, but this is not a guarantee. Prefer libraries with clear security policies and responsible disclosure mechanisms. Evaluate the library’s dependencies as well; a secure library might rely on insecure sub-dependencies.
Once a library is selected, **continuous vulnerability scanning and dependency management** are essential. Tools like `npm audit` (for Node.js projects), Snyk, or OWASP Dependency-Check can scan your project’s `package.json` and `package-lock.json` files to identify known vulnerabilities in your direct and transitive dependencies. These tools often provide remediation advice, such as updating to a patched version or suggesting alternative libraries. This should be integrated into your Continuous Integration/Continuous Deployment (CI/CD) pipeline, failing builds if critical vulnerabilities are detected. Regular scanning ensures that newly discovered vulnerabilities in older versions of your dependencies are promptly identified and addressed.
# Example: Running npm audit in a CI/CD pipeline# This command will check for known vulnerabilities and suggest fixesnpm audit --audit-level=critical # Only report critical vulnerabilitiesnpm audit fix --force # Attempt to automatically fix vulnerabilities (use with caution and review changes)Beyond automated scanning, **understanding the codebase of critical dependencies** is sometimes necessary. If a charting library handles sensitive data or performs complex operations, a manual code review by a security expert can uncover logic flaws or subtle vulnerabilities that automated tools might miss. This is particularly relevant for libraries that interact with native modules, as these can expose a broader attack surface. Pay close attention to how the library handles inputs, processes data, and interacts with the operating system or other native components.
**Minimizing the number of dependencies** is another effective strategy. Each additional dependency increases the supply chain risk. Evaluate if a complex charting library is truly necessary, or if a simpler, more lightweight option (or even a custom, purpose-built component for very specific needs) could suffice with fewer external risks. The fewer lines of third-party code you include, the smaller your attack surface.
Furthermore, consider **subresource integrity (SRI)** if you are loading any part of your charting solution from a CDN, although this is less common in typical React Native setups where dependencies are bundled. SRI ensures that the files fetched from a CDN have not been tampered with by comparing a cryptographic hash of the file. For React Native, the equivalent is ensuring the integrity of your bundled application and its dependencies before deployment, perhaps through digital signing or hash verification.
Finally, **segregation and sandboxing** can limit the impact of a compromised charting library. If possible, isolate the charting components from other highly sensitive parts of your application. While full sandboxing within a single React Native app is challenging, architectural decisions can help. For instance, ensuring that charting components only receive sanitized, non-sensitive data and have no direct access to critical application state or sensitive APIs can contain a breach to the visualization layer, preventing it from escalating to a full application compromise. This proactive approach to dependency management is vital for maintaining the overall security posture of your React Native application.
Secure Coding Practices for React Native Chart Integration
Integrating React Native charts securely requires more than just selecting a robust library; it demands a commitment to secure coding practices throughout the development lifecycle. Developers must adopt a defensive mindset, anticipating potential misuse and vulnerabilities at every stage of implementation. These practices are critical to prevent common security flaws from creeping into data visualization components.
The first and most fundamental practice is **strict input validation and sanitization**. All data fed into charting components, whether from backend APIs or user input, must be treated as untrusted. Validate data against expected types, formats, and ranges. For example, if a chart expects numerical data for an axis, reject or sanitize any non-numeric input. For textual labels or tooltips, sanitize the input to prevent XSS. While React Native’s JSX helps, developers must be vigilant when integrating with WebViews or any component that might render raw HTML or JavaScript. Never directly inject unsanitized user-generated content into a chart’s configuration or data structure. This is a common pitfall, especially when developers attempt to add rich text or dynamic styling based on user input.
// Example: Validating and sanitizing chart data and labelsfunction isValidChartData(data: any[]): boolean { if (!Array.isArray(data)) return false; return data.every(item => typeof item === 'object' && item !== null && typeof item.value === 'number' && (typeof item.label === 'string' || item.label === undefined || item.label === null) );};const sanitizeLabel = (label: string | undefined | null): string => { if (!label) return ''; // Basic HTML entity encoding for display in text elements // For more complex sanitization (e.g., if rendering in WebView), use a dedicated library return label.replace(/&/g, '&') .replace(//g, '>') .replace(/"/g, '"') .replace(/'/g, ''');};function renderSecureChart(rawData: any[]) { if (!isValidChartData(rawData)) { console.error('Invalid chart data received. Aborting render.'); // Log security event, display generic error to user return Error loading chart data. ; } const processedData = rawData.map(item => ({ ...item, label: sanitizeLabel(item.label) })); // ... Render chart using processedData ...}Next, implement **secure error handling and logging**. Charting components, like any other part of an application, can encounter errors. However, error messages should never expose sensitive system information, stack traces, or backend details to the client. Generic, user-friendly error messages should be displayed, while detailed error information should be securely logged on the backend for analysis. Client-side logging should also be carefully managed to avoid storing sensitive data in device logs, which could be accessible to other applications or forensic tools. This is particularly important when dealing with errors related to data parsing or API communication for charts.
Adhere to the **principle of least privilege**. Charting components should only have access to the data and resources absolutely necessary for their function. This applies to API access (e.g., specific data endpoints), local storage access, and even component state. Do not pass entire sensitive objects to a charting component if only a subset of data points is needed. This reduces the blast radius if the component itself is compromised or contains a flaw.
Consider **obfuscation and code splitting** for sensitive charting logic. While client-side obfuscation is not a security panacea, it can make reverse engineering more challenging, especially for proprietary algorithms or data transformations performed on the client. Code splitting can also help by loading charting components and their associated data only when needed, reducing the initial attack surface. Furthermore, avoid hardcoding API keys, secrets, or sensitive configuration parameters directly into the React Native bundle. These should be fetched securely from environment variables, a secure backend, or platform-specific secure storage at runtime.
Finally, incorporate **security testing** into your development workflow. This includes unit tests for data validation and sanitization, integration tests for API communication, and potentially penetration testing (pen testing) specifically targeting the data visualization features. Automated security linters and static analysis tools can also catch common coding errors that lead to vulnerabilities. This holistic approach ensures that secure coding practices are not just theoretical but are actively enforced and verified.
Runtime Security and Data Protection on the Device
Even after data has been securely transmitted and processed, its presence on the client device, particularly within the memory or temporary storage used by React Native charts, presents a unique set of runtime security challenges. A Security Engineer must consider how data can be protected against unauthorized access or tampering once it resides within the application’s execution environment on the mobile device.
One primary concern is **memory forensics**. Sensitive chart data, even if only temporarily stored in RAM for rendering, can be extracted by sophisticated attackers with root access to the device or through memory dumping techniques. While complete protection against this is difficult on a compromised device, minimizing the time sensitive data resides in memory and overwriting memory regions after use can help. For instance, clear out data objects containing PII or PHI immediately after the chart has been rendered and the data is no longer actively needed. Avoid keeping full, raw datasets in the application’s global state if only aggregated or transformed versions are displayed.
Another aspect is **protection against screen capture and unauthorized access**. Mobile operating systems often allow users or other applications to take screenshots or record the screen. If sensitive charts are displayed, this could lead to unintended data leakage. For highly sensitive applications, consider implementing features that detect screen capture attempts and either block them, blur the sensitive content, or notify the user. On iOS, you can use `UIScreen.main.isCaptured` (via a native module) to detect screen recording. On Android, `WindowManager.LayoutParams.FLAG_SECURE` can prevent screenshots. Integrating these native capabilities into your React Native chart components is crucial for protecting visual data.
// Example: React Native component to prevent screenshots on Android and detect on iOSimport React, { useEffect, useState } from 'react';import { NativeModules, Platform, View, Text } from 'react-native';const { ScreenshotDetector } = NativeModules; // Assume a native module for iOS detectionconst SecureChartWrapper = ({ children, isSensitive }: { children: React.ReactNode, isSensitive: boolean }) => { const [isScreenCaptured, setIsScreenCaptured] = useState(false); useEffect(() => { if (Platform.OS === 'android' && isSensitive) { // On Android, FLAG_SECURE prevents screenshots // This needs to be set at the Activity level or via a native module // For demonstration, let's assume a native function `setSecureFlag` exists // from a native module. // Example: `NativeModules.SecureScreen.setSecureFlag(true);` } if (Platform.OS === 'ios' && isSensitive && ScreenshotDetector) { // On iOS, listen for screenshot notifications const subscription = ScreenshotDetector.addScreenshotListener(() => { setIsScreenCaptured(true); // Optionally, blur content or log a security event console.warn('SCREENSHOT DETECTED!'); }); return () => subscription.remove(); } return () => { if (Platform.OS === 'android' && isSensitive) { // Example: `NativeModules.SecureScreen.setSecureFlag(false);` } }; }, [isSensitive]); if (isSensitive && isScreenCaptured) { return ( Sensitive content hidden due to screenshot detection. ); } return {children} ;};**Runtime application self-protection (RASP)** techniques can also be employed, though they are more complex to implement in React Native. RASP involves embedding security instrumentation into the application itself to detect and block attacks in real-time. For charting, this could mean monitoring for attempts to tamper with the chart’s data sources, rendering logic, or even the application’s memory where chart data resides. While full RASP solutions are often commercial, custom integrity checks for critical data and logic can be built into your application. This might involve checksums for data arrays or verifying the integrity of key functions before execution.
Finally, consider the broader device security posture. While not directly controlled by the application, educating users about device security (e.g., strong passcodes, avoiding rooted/jailbroken devices) and implementing checks for **rooting/jailbreaking** can enhance runtime security. If a device is detected as rooted or jailbroken, the application can choose to operate in a degraded mode, hide sensitive charts, or refuse to run altogether. This is a common practice for banking and financial applications but is equally relevant for any app displaying sensitive data. While these checks are not foolproof, they raise the bar for attackers.
In summary, runtime security for React Native charts involves a combination of careful memory management, proactive protection against screen capture, and, where feasible, implementing integrity checks and device posture assessments. These measures collectively aim to protect sensitive data even when it is actively being displayed and interacted with on the client device.
Security Audits and Continuous Monitoring for Charting Components
The integration of React Native charts, especially those displaying sensitive information, necessitates a robust and continuous security audit and monitoring strategy. Security is not a one-time event; it is an ongoing process that must evolve with new threats and vulnerabilities. For charting components, this means regularly assessing their security posture from design to deployment and beyond.
**Regular security audits** should be a cornerstone of your development process. This involves both automated and manual assessments. Automated tools, such as Static Application Security Testing (SAST) and Dynamic Application Security Testing (DAST) tools, can scan your React Native codebase and running application for common vulnerabilities. SAST tools can analyze your source code for insecure coding patterns related to data handling, API calls, and component rendering, specifically looking for issues that might affect chart data. DAST tools interact with the running application to identify vulnerabilities that manifest at runtime, such as insecure data exposure through network requests or client-side injection flaws.
Beyond automation, **manual security reviews and penetration testing** are indispensable. A skilled penetration tester can identify logical flaws, complex attack chains, and business logic vulnerabilities that automated tools often miss. This should include specific tests targeting your charting components: Can an attacker manipulate the data displayed? Can they inject malicious code into labels or tooltips? Can they exfiltrate sensitive data shown in charts? These tests should simulate real-world attack scenarios, including those targeting the specific client-side rendering mechanisms used by your chosen charting library. This often involves attempting to exploit the underlying WebView or native canvas rendering contexts.
Consider scheduling regular, perhaps annual or bi-annual, **third-party security audits** for your application, particularly if it handles highly sensitive data or falls under strict regulatory compliance. An independent security firm can provide an unbiased assessment and bring fresh perspectives on potential vulnerabilities in your React Native chart implementations and the surrounding architecture.
**Continuous monitoring** is equally crucial. This involves setting up telemetry and logging systems that can detect suspicious activities related to your charting components. Monitor for:
- **Unusual data access patterns:** Are there spikes in requests for chart data from a particular user or IP address?
- **Client-side errors:** Are there frequent errors related to chart rendering or data processing that might indicate tampering attempts or malformed data injections?
- **Failed API requests:** An increase in failed authentication or authorization requests for chart data could signal brute-force attacks.
- **Security alerts from underlying platforms:** Monitor for alerts from mobile OS platforms (e.g., integrity checks, debugger detection) that might indicate a compromised device attempting to access chart data.
Integrating these logs with a **Security Information and Event Management (SIEM)** system allows for centralized analysis and alert generation. An effective SIEM can correlate events across your backend, API gateway, and mobile application telemetry to provide a holistic view of potential threats. When an alert is triggered, a defined incident response plan should be in place to investigate, contain, and remediate the issue promptly.
Furthermore, stay informed about **new vulnerabilities and security advisories** related to React Native, its ecosystem, and specifically your chosen charting libraries. Subscribe to security mailing lists, monitor CVE databases, and regularly check the release notes of your dependencies. Promptly apply security patches and updates. This proactive threat intelligence gathering ensures that your application remains resilient against emerging threats. For critical vulnerabilities, it may even be necessary to issue an out-of-band patch or a forced update to users.
In essence, security audits and continuous monitoring for React Native charting components are not optional. They are integral to maintaining a secure application, demonstrating due diligence, and protecting sensitive data from ever-evolving threats. This vigilant approach ensures that the visual insights provided by your charts do not come at the cost of security.
Architectural Considerations for Secure Chart Data Flows
The security of React Native charts extends beyond individual coding practices to the fundamental architecture governing data flow. A well-designed architecture minimizes attack vectors and enforces security at multiple layers, especially when sensitive data is involved. From a Security Engineer’s perspective, the entire data pipeline must be considered, not just the rendering component.
A key architectural principle is **separation of concerns** and **layered security**. The backend responsible for data storage and processing should be distinct from the API gateway that serves data to the mobile application. This allows for specific security controls at each layer. For instance, the database layer might enforce row-level security, while the API layer implements fine-grained authorization policies and rate limiting. The mobile application, in turn, focuses on secure data consumption and rendering, not on enforcing core business logic or access control that should reside server-side.
Consider a **microservices architecture** where data processing services are isolated. Instead of a monolithic API serving all data, create specific, hardened microservices dedicated to aggregating and transforming data specifically for charts. These services can apply anonymization, pseudonymization, and aggregation logic before the data is exposed to the client-facing API. This reduces the amount of sensitive raw data that ever leaves the secure backend perimeter. Each microservice can have its own robust authentication and authorization mechanisms, ensuring that only authorized internal components can request sensitive data for charting purposes.
The use of an **API Gateway** is crucial. An API Gateway acts as a single entry point for all client requests, allowing for centralized enforcement of security policies such as authentication, authorization, rate limiting, and input validation before requests reach your backend services. For chart data, this means that even if a client attempts to bypass authorization or flood your services, the API Gateway can block such attempts, protecting your data sources. It can also perform schema validation on incoming data requests and outgoing responses, ensuring that only well-formed data is exchanged, which is vital for preventing injection attacks and data leakage. This is particularly relevant when considering how a Next.js New App might interact with backend services, leveraging its API routes for controlled data access.
For data storage, adopt a **data segmentation strategy**. Instead of storing all sensitive and non-sensitive data in a single database, segment it. For example, PII might be stored in a highly secured, encrypted database, while aggregated, anonymized chart data could reside in a separate, less restricted data store. This limits the impact of a breach; a compromise of the less sensitive data store would not immediately expose core PII. Additionally, ensure that database access is strictly controlled, using strong authentication, encryption for data at rest, and auditing of all data access attempts. This applies whether you are using traditional MySQL or a modern solution like Supabase.
**Secure communication channels** between all architectural components are paramount. Internal API calls between microservices should also be encrypted (e.g., using mutual TLS) and authenticated. This prevents lateral movement by an attacker who might compromise one service and then attempt to access others. Network segmentation and firewalls should be configured to restrict traffic between services to only what is absolutely necessary, following the principle of least privilege at the network level.
Finally, for dynamic content or complex chart interactions that might traditionally involve server-side rendering (SSR), consider the security implications of client-side rendering (CSR) or Static Site Generation (SSG) in a framework like Next.js. While a Next.js No SSR approach can reduce server load and complexity, it shifts more responsibility for data security to the client-side, requiring enhanced client-side validation and protection. The choice between SSR and CSR for data heavy applications should involve a thorough security impact assessment, balancing performance and user experience with the need to protect sensitive data. Each architectural decision has security trade-offs that must be carefully evaluated and documented through Architecture Decision Records (ADRs).
Incident Response and Recovery for Chart Data Breaches
Despite the most rigorous preventative measures, security incidents, including data breaches involving sensitive chart data, can still occur. A Security Engineer’s responsibility extends to preparing for these inevitable events with a comprehensive incident response and recovery plan. The speed and effectiveness of this plan can significantly mitigate the damage and ensure regulatory compliance.
The first step is establishing a clear **incident response team** with defined roles and responsibilities. This team should include representatives from security, development, operations, legal, and public relations. Each member must understand their part in identifying, containing, eradicating, recovering from, and post-incident analysis of a breach related to chart data. This ensures a coordinated and rapid response rather than a chaotic one.
**Detection and analysis** are critical initial phases. Your continuous monitoring systems, as discussed previously, should be configured to immediately alert the incident response team to suspicious activities related to chart data access, manipulation, or unusual error patterns. Once an alert is received, the team must quickly analyze the scope and nature of the incident: What data was affected? Which charts or components were involved? What was the entry point? This analysis is crucial for determining the appropriate containment strategy. Tools for forensic analysis of mobile devices and backend logs should be readily available and the team trained in their use.
**Containment** aims to prevent further damage. For a chart data breach, this might involve temporarily disabling the affected charting features, revoking API keys, blocking suspicious IP addresses, or taking the relevant backend services offline. The goal is to stop the bleeding without causing undue disruption to other, unaffected parts of the application. The containment strategy must be carefully considered to minimize impact while maximizing security. For example, if a specific chart is found to be vulnerable to XSS due to untrusted input, the immediate action might be to disable that chart or replace it with a static placeholder while a fix is developed and deployed.
**Eradication** involves removing the root cause of the incident. This could mean patching the vulnerable charting library, fixing insecure coding practices, updating API authentication mechanisms, or removing malicious code injected into the application bundle. For chart data, this might also involve verifying the integrity of the data sources to ensure no data was permanently altered or corrupted by the attacker. All changes must be thoroughly tested in a staging environment before deployment to production.
**Recovery** focuses on restoring normal operations securely. This includes deploying patched code, restoring any compromised data from secure backups (if necessary), and re-enabling services. A critical step in recovery is implementing enhanced monitoring to ensure the threat has been fully eradicated and does not reappear. For chart data, this might mean re-verifying the data integrity and accuracy before re-displaying it to users, especially if the breach involved data manipulation.
Finally, a **post-incident analysis (PIR)** is essential for continuous improvement. This involves documenting everything: what happened, how it was handled, what worked, what didn’t, and what lessons were learned. Identify weaknesses in the existing security controls, processes, or technologies that allowed the incident to occur. Update your security policies, architectural guidelines, and secure coding standards based on these findings. For instance, if a chart data breach occurred due to an unpatched library, the PIR might recommend a more stringent dependency vetting process or more frequent vulnerability scanning.
Regularly reviewing and updating the incident response plan, especially as your application evolves and new charting features are introduced, is paramount. Conducting tabletop exercises and simulations can help the team practice their roles and identify gaps before a real incident occurs. This proactive approach to incident response ensures that your organization is prepared to handle security events involving sensitive chart data, minimizing their impact and maintaining trust.
Future-Proofing React Native Chart Security
The landscape of mobile application security and data visualization is constantly evolving. To maintain a robust security posture for React Native charts, a strategy of continuous adaptation and future-proofing is essential. This involves staying ahead of emerging threats, adopting new security technologies, and fostering a security-first culture within the development team.
One critical aspect is **staying informed about the latest security research and vulnerabilities**. Subscribe to security advisories from CERTs, OWASP, and major cloud providers. Monitor vulnerability databases for React Native, its core dependencies, and specifically the charting libraries you utilize. The React Native ecosystem is dynamic, with new versions and libraries emerging frequently, each potentially introducing new features and, consequently, new attack surfaces. Proactively understanding these changes allows for timely assessment and mitigation.
Embrace **DevSecOps principles** by integrating security into every phase of the software development lifecycle (SDLC), rather than treating it as a separate gate at the end. For React Native charts, this means security considerations are part of the initial design, coding, testing, and deployment. Automated security tools within your CI/CD pipeline, such as SAST for code analysis and dependency scanners, become non-negotiable. This ‘shift left’ approach helps catch vulnerabilities early, making them cheaper and easier to fix, rather than discovering them in production where they pose a significant risk.
Invest in **developer security training**. Developers are the first line of defense. Equipping your React Native developers with up-to-date knowledge on secure coding practices, common mobile application vulnerabilities (e.g., OWASP Mobile Top 10), and the specific security implications of charting libraries is crucial. Training should cover topics like secure data handling, input validation, API security, and the proper use of secure storage mechanisms. A well-informed development team is less likely to introduce vulnerabilities inadvertently.
Explore **advanced authentication and authorization mechanisms**. As threats evolve, so too must your defenses. Consider implementing multi-factor authentication (MFA) for accessing sensitive data, especially for administrative interfaces that configure chart data sources. For user authentication, look into FIDO2/WebAuthn for passwordless authentication, which offers stronger phishing resistance than traditional password-based methods. For internal systems, explore zero-trust network architectures where no entity, inside or outside the network, is trusted by default. This is particularly relevant for securing the backend APIs that feed data to your React Native charts, as discussed in the context of Google 2 Factor Authentication: Architecting Secure Systems with TOTP.
Consider **privacy-enhancing technologies (PETs)**. As data privacy regulations become more stringent, PETs like differential privacy or secure multi-party computation could become relevant for generating insights from sensitive data without exposing individual data points. While complex to implement, these technologies represent the cutting edge of data protection for aggregated visualizations. For instance, if your charts display aggregated user behavior, differential privacy could add noise to the data to prevent re-identification of individuals while preserving the overall statistical trends.
Finally, regularly **review and update your security architecture**. As your application grows and new features are added, the initial architectural decisions might become outdated or expose new attack vectors. Conduct periodic architecture reviews, specifically focusing on data flows to and from your React Native charts. Document these decisions and their security implications using Architecture Decision Records (ADRs). This proactive review process ensures that your security architecture remains robust and adaptable to new requirements and threats, much like the strategic initialization required for an Next.js New App: Strategic Initialization for Enterprise Web Applications.
Securing React Native charts is a complex but indispensable endeavor for any application handling sensitive data. It demands a holistic approach that spans secure data handling, robust API communication, vigilant client-side protection, rigorous dependency management, and a proactive incident response strategy. While charting libraries offer powerful visualization capabilities, their integration must always be viewed through a security lens, prioritizing data confidentiality, integrity, and availability above all else.
By meticulously implementing the principles outlined, from applying least privilege to data, enforcing strong encryption in transit and at rest, to continuously monitoring for vulnerabilities, organizations can build React Native applications where data visualizations are both informative and secure. This commitment safeguards user trust, ensures regulatory compliance, and protects against the potentially devastating consequences of a data breach.
For organizations seeking to validate and strengthen their mobile application security posture, particularly concerning data visualization components, a thorough architecture review is a critical next step. Our team specializes in assessing existing systems for vulnerabilities, identifying architectural weaknesses, and providing actionable recommendations to enhance security across your entire application stack, including your React Native charting implementations.
NR Studio builds custom web apps, mobile apps, SaaS platforms, and internal tools for growing businesses. If you’re working through a technical decision, feel free to reach out — no commitment required.