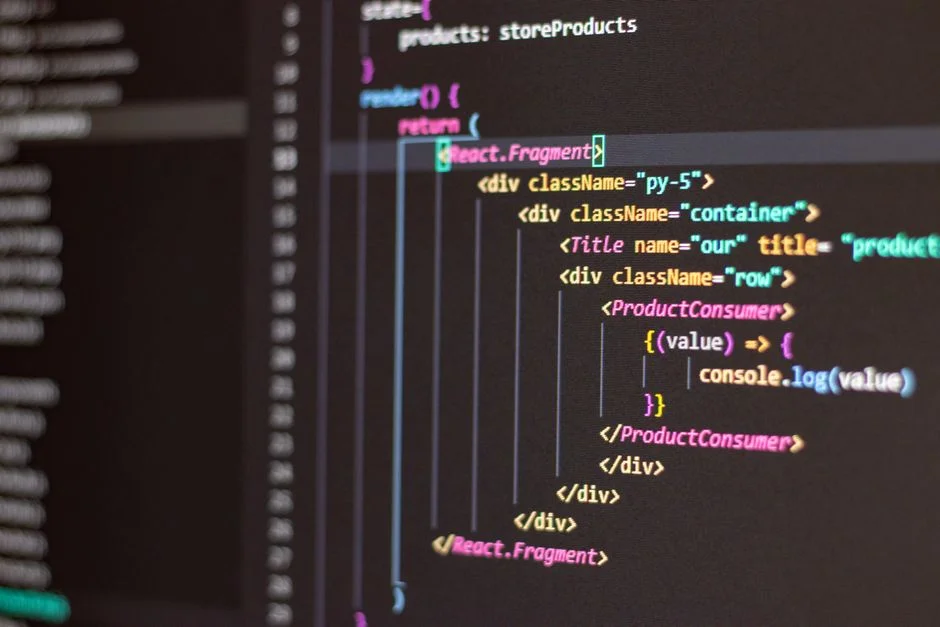

React Developer Tools are a browser extension that allows developers to inspect, debug, and understand the component hierarchy, state, and props of React applications directly within the browser’s developer console. They provide critical insights into application behavior, facilitate performance optimization, and significantly accelerate the debugging process, acting as an indispensable asset for any React development team.
The increasing complexity of modern web applications, coupled with the rising demand for highly performant and stable user interfaces, has elevated React Developer Tools from a convenient utility to a strategic necessity. This trend reflects a broader industry shift towards empowering developers with sophisticated introspection capabilities, directly impacting team velocity, code quality, and ultimately, the total cost of ownership (TCO) of software projects. Organizations recognize that investing in developer enablement tools like this directly translates to tangible business advantages, including faster feature delivery and reduced operational overhead.
From a CTO’s vantage point, the adoption and proficient use of these tools are not merely about developer comfort; they are about establishing a robust engineering culture that prioritizes efficiency, maintainability, and diagnostic precision. Without deep visibility into the runtime behavior of React components, identifying performance bottlenecks, tracking state changes, and debugging complex interactions becomes a time-consuming and error-prone endeavor, directly impacting project timelines and increasing technical debt.
The Core Functionality of React Developer Tools: A Strategic Overview
At its foundation, React Developer Tools is a powerful suite designed to provide granular visibility into the inner workings of any React application. This browser extension, available for Chrome, Firefox, and Edge, fundamentally transforms how developers interact with and understand their React codebase at runtime. From a strategic perspective, its core functionality directly addresses critical challenges in modern software development: complexity management, debugging efficiency, and performance optimization.
The primary interface is divided into two main tabs: the Components tab and the Profiler tab. The Components tab presents a hierarchical tree of all React components rendered on the page, allowing developers to select any component and inspect its current props, state, and hooks. This immediate access to runtime data is invaluable for diagnosing issues related to data flow, unexpected component behavior, or incorrect state updates. For instance, a developer can observe how props change as a user interacts with the application, pinpointing exactly where data might be diverging from expectations. This level of transparency dramatically reduces the time spent on traditional debugging methods, such as `console.log` statements, which often clutter the codebase and provide a less structured view of the application’s state.
Beyond basic inspection, the Components tab also offers features like:
- Direct State and Props Editing: Developers can modify state and props directly from the panel, enabling rapid testing of different scenarios without altering source code and recompiling. This interactive debugging capability accelerates the iteration cycle significantly.
- Source Code Navigation: The tool allows jumping directly to the component’s source code in the developer’s IDE, facilitating quick adjustments and deeper investigation. This integration streamlines the developer workflow, minimizing context switching.
- Component Filters: For large applications, the ability to filter components by name or type helps developers focus on relevant parts of the component tree, preventing information overload.
The Profiler tab, on the other hand, is dedicated to performance analysis. It records how components render and re-render over time, providing detailed insights into rendering costs and identifying potential bottlenecks. This data is presented visually, making it easy to spot components that re-render unnecessarily or take too long to render. For a CTO, performance directly translates to user experience and infrastructure costs. An application that is slow or unresponsive due to inefficient rendering can lead to user dissatisfaction, increased bounce rates, and potentially higher server loads if client-side rendering inefficiencies translate to more backend requests or longer page load times requiring more resources. The Profiler helps mitigate these risks by providing actionable data for performance tuning.
Understanding and leveraging these core functionalities is not just about individual developer productivity; it’s about building a collective intelligence within the engineering team. It establishes a common language for discussing component behavior and performance, enabling more effective code reviews and knowledge transfer. For instance, when a new team member is onboarding, using these tools provides a faster path to understanding the existing codebase’s architecture and data flow than purely static code analysis. This strategic adoption contributes directly to reducing technical debt by encouraging proactive debugging and performance optimization throughout the development lifecycle, rather than reacting to production issues. The tools also support a more robust quality assurance process, as QA engineers can use them to provide more precise bug reports, detailing component states and props at the moment of an issue, which significantly reduces the reproduction time for developers.
Enhancing Team Velocity Through Component Inspection and Debugging
Team velocity, a critical metric for any engineering leader, is significantly influenced by the efficiency of the development and debugging processes. React Developer Tools, particularly its Components tab, serves as a force multiplier in this regard, directly impacting how quickly features are developed, issues are resolved, and new team members become productive. The ability to inspect component hierarchies, props, and state in real-time provides an unparalleled level of transparency into the application’s runtime behavior, which is a cornerstone for high-velocity teams.
Consider the scenario of debugging a complex UI bug where a component is not rendering correctly or displaying outdated data. Without React Developer Tools, a developer might resort to peppering the code with `console.log` statements, recompiling, and refreshing the browser repeatedly. This iterative process is not only time-consuming but also introduces noise into the codebase and can be difficult to manage across multiple developers. With the Components tab, a developer can select the problematic component, immediately see its received props, its internal state, and even the values of any Hooks it uses. If a prop is incorrect, they can trace it up the component tree to its origin. If the state is not updating as expected, they can see the exact state object and its mutations.
This immediate feedback loop is crucial for maintaining developer flow and reducing context switching. Instead of guessing and checking, developers can diagnose issues with precision. Furthermore, the capability to edit props and state directly within the dev tools allows for rapid experimentation. A developer can simulate different data inputs or state transitions to verify a fix or explore edge cases without touching the source code. This interactive debugging environment accelerates the identification of root causes and the validation of solutions, directly translating to faster bug resolution times and quicker feature iterations.
Beyond debugging, component inspection also plays a vital role in feature development and code comprehension. When integrating a new feature or working on an existing part of the application, developers can use the component tree to understand how different UI elements are structured, what data they expect, and how they interact. This is particularly beneficial for large, mature applications with many components. It reduces the cognitive load required to understand an unfamiliar part of the codebase, making developers more productive from day one. For instance, a junior developer or a new hire can quickly grasp the data flow of a specific UI section by visually tracing props down the component tree, rather than relying solely on static code analysis or extensive documentation that might be out of date.
From a strategic management perspective, this tool set fosters a more collaborative and efficient development environment. During code reviews, developers can use screenshots or screen recordings that highlight specific component states or prop values from the dev tools to illustrate an issue or a proposed change. This precision in communication reduces ambiguity and speeds up the review process. When dealing with an application built on a framework like Laravel for the backend and React for the frontend, understanding the exact data received by the React components from the API is paramount. React Developer Tools provide the client-side visibility to confirm data integrity and format, complementing backend debugging efforts and ensuring seamless integration between the two layers.
Ultimately, by significantly reducing the time spent on debugging and increasing the speed at which developers can understand and interact with the codebase, React Developer Tools directly contribute to enhanced team velocity. This velocity is not just about writing more lines of code, but about delivering high-quality, stable features to production faster, thereby improving time-to-market and enabling the business to respond more agilely to market demands. It is an investment in developer efficiency that yields substantial returns in project timelines and overall software quality.
Optimizing Application Performance with the Profiler Tab
Application performance is a non-negotiable requirement for modern software, directly influencing user satisfaction, retention, and ultimately, business outcomes. Slow-loading pages, janky animations, or unresponsive UIs can severely degrade the user experience, leading to lost revenue and damaged brand reputation. React Developer Tools’ Profiler tab is an indispensable asset for engineering leaders focused on delivering high-performance applications, offering deep insights into rendering behavior and component-level performance bottlenecks.
The Profiler allows developers to record a session of user interaction or application loading and then analyze the performance characteristics of every React component during that period. It visualizes the component rendering process, showing exactly which components rendered, why they rendered (e.g., state change, prop change, context change), and how long each render cycle took. This granular data is presented through flame graphs, ranked charts, and component interaction graphs, making it intuitive to identify performance hogs.
Key metrics and visualizations provided by the Profiler include:
- Flame Graph: Shows the rendering activity over time, with each bar representing a component. The width of the bar indicates the time spent rendering, while the color often denotes the rendering frequency or duration relative to others. This quickly highlights components that are re-rendering excessively or taking a long time to complete their render cycle.
- Ranked Chart: Lists components by their total render time, from longest to shortest. This is a quick way to pinpoint the most expensive components in terms of rendering cost.
- Component Chart: Provides a historical view of a single component’s renders, showing when and why it rendered during the profiling session. This is critical for understanding unnecessary re-renders.
The ability to pinpoint unnecessary re-renders is particularly powerful. React’s reconciliation algorithm is highly optimized, but developers can inadvertently cause components to re-render more often than necessary, leading to performance degradation. Common culprits include passing new object references as props on every render, not memoizing expensive computations, or incorrect usage of `React.memo`, `useMemo`, or `useCallback`. The Profiler exposes these inefficiencies directly, allowing developers to target their optimization efforts precisely. For example, if a large, static component is re-rendering every time a small piece of state changes elsewhere in the application, the Profiler will highlight this. The engineering team can then implement memoization strategies or refactor the component to prevent these wasteful updates, significantly improving the application’s responsiveness.
From a CTO’s perspective, optimizing application performance with the Profiler has direct financial implications. A faster application translates to:
- Reduced Infrastructure Costs: More efficient client-side rendering can reduce the load on backend servers by potentially processing more data locally or making fewer requests, leading to lower hosting and operational expenditures.
- Improved Conversion Rates: Studies consistently show a strong correlation between page load speed and user engagement/conversion. An optimized application directly contributes to business revenue.
- Enhanced Developer Productivity: By providing clear, actionable performance data, the Profiler reduces the guesswork involved in optimization, allowing developers to apply targeted fixes rather than engaging in speculative refactoring.
Integrating performance profiling into the development workflow using these tools fosters a culture of performance awareness. It encourages developers to consider the rendering cost of their components and to write more efficient React code from the outset. This proactive approach to performance optimization helps prevent the accumulation of performance debt, which can be far more costly and time-consuming to address retrospectively. The Profiler acts as a diagnostic tool that empowers teams to not just build features, but to build performant and resilient applications that meet the demanding expectations of today’s users. It’s a strategic investment in the longevity and success of the product, ensuring that the application remains competitive and delivers a superior user experience.
State Management and Debugging Complex Applications
Modern React applications often manage intricate state logic, ranging from local component state to global application state handled by libraries like Redux, Zustand, or the React Context API. Debugging issues related to state management can be one of the most challenging aspects of front-end development, directly impacting the stability and predictability of an application. React Developer Tools provide indispensable capabilities for inspecting and manipulating state, making it a critical asset for managing the complexity inherent in large-scale applications.
The Components tab allows developers to select any component and immediately view its internal state and the props it receives from its parent. This direct visibility is paramount when trying to understand why a component is behaving unexpectedly. For instance, if a form field isn’t updating correctly, a developer can inspect the component to see if its `value` prop or internal `useState` hook is holding the expected data. This eliminates the need for `console.log` statements that might reveal the state at a single point in time but fail to show its evolution.
Furthermore, for components that use React Hooks, the Developer Tools provide specific insights into `useState`, `useEffect`, `useContext`, `useReducer`, and custom hooks. Developers can see the current values of state variables managed by `useState` and the dependencies of `useEffect` hooks. This is incredibly useful for diagnosing common issues like stale closures, infinite re-renders due to incorrect `useEffect` dependencies, or unexpected context values. The ability to track the values of these hooks in real-time allows for precise problem identification, drastically reducing debugging cycles.
When applications utilize external state management libraries, the integration capabilities of React Developer Tools often extend to these as well. For example, Redux DevTools, while a separate extension, works synergistically with React Developer Tools, providing a complete picture of both React component state and the global Redux store. This comprehensive view is essential for debugging scenarios where an issue might stem from either the component’s local state or a dispatch action affecting the global store. The ability to see the flow of data across these layers within a unified debugging environment streamlines the diagnostic process.
From a strategic standpoint, proficient use of these state inspection capabilities directly contributes to the reduction of technical debt. Unresolved state-related bugs can accumulate quickly, leading to brittle codebases that are difficult to maintain and extend. By enabling developers to thoroughly understand and debug state interactions, the tools promote cleaner state management patterns and more robust application logic. This proactive approach ensures that applications remain stable and scalable as they evolve, preventing costly refactoring efforts down the line.
Moreover, for teams working on applications with complex data flows, these tools facilitate knowledge transfer. When a new developer joins a project, they can use the React Developer Tools to quickly grasp how data is managed and flows through components, even if the state management architecture is intricate. This accelerates onboarding and allows new team members to contribute effectively much sooner. The explicit visibility into component state, props, and hooks provides a living documentation of the application’s data layer, complementing traditional code documentation and architectural diagrams. This strategic investment in developer tooling helps ensure that the application’s underlying data integrity is maintained, a critical factor for business-critical systems like ERP or CRM platforms where data accuracy is paramount. The ability to quickly identify and rectify state-related anomalies ensures that the application remains reliable and trustworthy, upholding the integrity of the business processes it supports.
Advanced Debugging Techniques and Workflow Integration
Beyond the fundamental inspection of components and state, React Developer Tools offer a suite of advanced features that, when integrated into a mature development workflow, can significantly elevate debugging efficiency and code quality. For a CTO, understanding these capabilities means recognizing opportunities to refine engineering practices, enhance developer skill sets, and ultimately deliver more resilient software faster. These advanced techniques move beyond simple inspection to proactive problem-solving and deeper system understanding.
One powerful feature is the ability to filter components in the component tree. In large applications with numerous components, finding a specific component can be challenging. The search functionality allows developers to quickly locate components by name, reducing navigation time. Furthermore, the option to hide host components (like `div`, `span`, `p`) allows developers to focus solely on React components, cleaning up the tree view and making it easier to understand the application’s logical structure. This targeted focus is crucial when dealing with deeply nested UIs or complex component libraries.
The integration with the browser’s native developer tools is another critical aspect. React Developer Tools often provide links or buttons that, when clicked, jump directly to the selected component’s DOM node in the ‘Elements’ tab or its associated styles in the ‘Styles’ pane. This seamless transition between React’s virtual DOM representation and the actual browser DOM is invaluable for debugging styling issues, layout problems, or interactions with native browser APIs. This interoperability ensures that developers have a holistic view of both the React-specific aspects and the underlying web platform behavior.
For inspecting component source code, the ‘Go to source’ feature is incredibly efficient. Instead of manually searching for a component file in the IDE, a single click in React Developer Tools opens the exact file and line number where the component is defined. This direct navigation minimizes context switching and accelerates the process of understanding and modifying component logic. This feature is particularly useful in large monorepos or projects with complex file structures, where locating a specific component’s definition might otherwise be a tedious task. Integrating this into a software development workflow drastically cuts down on navigation overhead.
Another advanced technique involves utilizing the ‘Break on render’ feature. This allows developers to pause execution whenever a specific component renders. This is exceptionally useful for understanding the exact sequence of events that lead to a re-render, especially when dealing with complex state updates or side effects. By stepping through the code during a render, developers can trace data flow, verify prop values, and identify unexpected render triggers, which is far more effective than relying on `console.log` for dynamic processes. This level of control over the execution flow is akin to using a debugger for backend code, bringing similar precision to frontend development.
Finally, understanding how to use the ‘Settings’ panel within React Developer Tools can customize the debugging experience. Options like highlighting updates, showing owner/renderers, or configuring color themes can tailor the tools to individual preferences and specific debugging needs. For instance, enabling ‘Highlight Updates’ visually flashes components on the page when they re-render, providing immediate visual feedback on performance characteristics. This is a simple yet powerful way to get a quick overview of what’s happening on the screen without diving deep into the Profiler immediately.
By mastering these advanced techniques and ensuring their consistent application across the development team, organizations can establish a higher standard for debugging and code quality. This leads to fewer bugs in production, faster incident response times, and a more robust and maintainable codebase, all of which are direct contributors to a healthier bottom line and a more agile engineering organization. These tools are not just for fixing bugs; they are for building a deeper understanding of the application’s runtime behavior, empowering developers to write more intentional and performant code.
The Strategic Imperative: Reducing Total Cost of Ownership (TCO)
From a CTO’s strategic vantage point, every technology choice and development practice must be evaluated through the lens of Total Cost of Ownership (TCO). While React Developer Tools are freely available, their impact on TCO is profound, driven by their ability to significantly reduce developer effort, accelerate project timelines, and enhance software quality. The costs associated with software development extend far beyond initial build expenses to encompass ongoing maintenance, debugging, performance optimization, and developer onboarding. React Developer Tools directly address these long-term cost drivers.
Reducing Debugging Overhead
The most immediate and quantifiable impact of React Developer Tools on TCO is the reduction in debugging time. Without these tools, developers often rely on primitive methods like `console.log` statements, which are inefficient, prone to error, and require repeated code changes and browser refreshes. This manual process can easily consume 20-30% of a developer’s time on complex issues. By providing real-time inspection of component state, props, and hooks, the tools dramatically cut down the time required to identify the root cause of bugs. If a senior developer earning $150,000 annually spends 20% of their time debugging, that’s $30,000 per year. Reducing this by even half through efficient tooling represents a direct saving of $15,000 per developer per year, scaling significantly across a team.
Accelerating Feature Development and Time-to-Market
Faster debugging directly translates to faster feature development. When developers can quickly isolate and fix issues, they spend more time building new functionalities. This acceleration in time-to-market allows businesses to capitalize on opportunities sooner, gain competitive advantages, and respond rapidly to user feedback. For a startup, this agility can be the difference between success and failure. The intangible benefit of being first to market with a critical feature, or iterating faster than competitors, can be worth millions, far outweighing any perceived ‘cost’ of developer tooling.
Improving Code Quality and Reducing Technical Debt
React Developer Tools foster a deeper understanding of how React applications behave at runtime. This enhanced understanding enables developers to write more robust, performant, and maintainable code from the outset. By proactively identifying performance bottlenecks with the Profiler or spotting incorrect state updates, teams can prevent the accumulation of technical debt. Technical debt, if left unchecked, can lead to exponential increases in maintenance costs, slower future development, and an increased likelihood of critical production bugs. The cost of technical debt can easily reach 15-20% of a project’s annual budget in large organizations, making proactive mitigation a strategic imperative.
Streamlining Onboarding and Knowledge Transfer
For new hires or developers transitioning to different parts of a large codebase, React Developer Tools provide an accelerated learning curve. The ability to visually explore the component hierarchy and data flow offers a living documentation of the application’s architecture. This reduces the time and resources spent on onboarding, which can be substantial. If onboarding a new senior developer costs $10,000-$20,000 in lost productivity and training time, tools that cut this by 25% offer a clear return on investment.
Operational Cost Reduction and Stability
Applications that are well-debugged and optimized typically experience fewer production incidents. Each production incident carries a significant cost, not just in terms of developer time spent on hotfixes, but also in potential revenue loss, reputational damage, and customer churn. Proactive use of React Developer Tools to catch and resolve issues during development contributes to greater application stability, thereby lowering operational costs associated with incident management and improving overall system reliability. This stability is particularly crucial for systems processing sensitive data or managing critical business operations, where downtime can have catastrophic consequences.
In summary, while React Developer Tools themselves are free, their strategic adoption and proficient use are paramount for reducing the overall TCO of React-based projects. They represent an investment in developer efficiency, code quality, and operational stability that yields substantial long-term financial and strategic benefits for any organization.
Integrating React Developer Tools into CI/CD and Quality Assurance
While React Developer Tools are primarily associated with local development and debugging, their principles and capabilities can be strategically integrated into Continuous Integration/Continuous Deployment (CI/CD) pipelines and Quality Assurance (QA) processes. This integration elevates the overall quality and stability of React applications, ensuring that issues are caught earlier in the development lifecycle and that performance regressions are prevented before reaching production. For a CTO, this means a more robust release process and higher confidence in software deployments.
Automated Performance Baselines in CI/CD
Although the React Profiler is an interactive tool, the insights it provides can inspire automated performance checks. For instance, CI/CD pipelines can incorporate tools like Lighthouse or WebPageTest to establish performance baselines for key user flows. While these don’t use React Developer Tools directly, the understanding gained from profiling helps define what metrics to track (e.g., Time to Interactive, Largest Contentful Paint) and what component-level optimizations are critical. If the Profiler reveals that a specific component is consistently heavy, the CI/CD pipeline can be configured to fail builds if performance metrics tied to that component’s rendering exceed acceptable thresholds. This ensures that performance regressions are flagged automatically.
Enhanced Bug Reporting for QA Teams
QA engineers can leverage React Developer Tools to provide significantly more precise and actionable bug reports. Instead of generic descriptions like “the button doesn’t work,” a QA tester can inspect the component’s state and props at the moment of failure and include screenshots of the DevTools panel in their bug report. This includes:
- The exact props received by the component.
- The current state of the component.
- Any relevant context values.
- The component’s position in the tree.
This detailed information drastically reduces the time developers spend reproducing bugs. When a developer receives a bug report that includes the precise state of the application at the point of failure, they can often replicate the issue immediately and proceed directly to diagnosis, rather than spending hours on reproduction steps. This efficiency gains in the QA-to-development feedback loop directly contributes to faster bug resolution and improved time-to-market for stable releases. It transforms bug reporting from a descriptive exercise into a diagnostic one.
Promoting a Culture of Proactive Quality
Integrating the mindset of React Developer Tools into CI/CD and QA means fostering a culture where quality is a shared responsibility. Developers, armed with profiling data, write more performant code. QA teams, empowered by granular component inspection, provide higher-fidelity bug reports. This collaborative approach leads to fewer defects escaping into production, thereby reducing the cost of fixing bugs post-release, which is significantly higher than fixing them during development.
Furthermore, during code reviews, developers can be encouraged to discuss potential performance implications identified through profiling or to demonstrate how specific state changes are managed, using the DevTools as a shared reference point. This elevates the quality of discussions and ensures that architectural and implementation decisions are made with a clear understanding of their runtime impact. For complex applications, especially those developed with a robust backend like Laravel, ensuring the frontend’s integrity and performance is just as crucial as the backend’s reliability. The synergy between strong backend architecture and a well-optimized, debugged React frontend leads to a truly resilient and high-performing system. By establishing these practices, an organization can build a more mature and efficient software delivery pipeline, reinforcing the strategic value of comprehensive developer tooling.
The Business Impact of Developer Productivity and Tooling Investment
From a CTO’s perspective, investments in developer tooling, such as React Developer Tools, are not merely operational expenses but strategic investments that yield significant business returns. The direct correlation between developer productivity and business success is undeniable: highly productive teams deliver more features, with higher quality, in less time. This translates directly to enhanced market competitiveness, improved customer satisfaction, and optimized operational costs.
Accelerated Innovation and Market Responsiveness
When developers are equipped with efficient tools, they spend less time on tedious debugging and more time on innovative problem-solving and feature development. This acceleration allows the business to bring new products and services to market faster, respond more swiftly to evolving customer demands, and outmaneuver competitors. In dynamic markets, the ability to rapidly iterate and deploy new capabilities is a critical differentiator. React Developer Tools, by streamlining the frontend development cycle, contribute directly to this agility, allowing product teams to experiment and validate ideas with greater velocity.
Enhanced Product Quality and User Experience
Tools that enable deep inspection and performance profiling directly contribute to a higher quality end-product. Fewer bugs, smoother user interfaces, and faster load times result in a superior user experience. A positive user experience is paramount for customer retention, brand loyalty, and positive word-of-mouth. Conversely, a buggy or slow application can lead to high churn rates and negative reviews, directly impacting revenue and market perception. The proactive identification and resolution of performance and functional issues, facilitated by React Developer Tools, are therefore investments in the product’s long-term success and market standing.
Optimized Resource Allocation and Cost Efficiency
The efficiency gains from using these tools translate into optimized resource allocation. If a team can achieve the same output with fewer developer hours, those resources can be reallocated to other strategic initiatives, such as exploring new technologies, expanding into new markets, or tackling technical debt. Alternatively, the same team can deliver significantly more value within the existing budget. This cost efficiency extends beyond just developer salaries; it impacts infrastructure costs (through performance optimization), operational costs (fewer production incidents), and even recruitment costs (by making the engineering team more attractive to top talent due to a modern and efficient tech stack).
Reduced Risk and Increased Predictability
Robust debugging and profiling capabilities reduce the inherent risks associated with software development. The likelihood of critical bugs reaching production is diminished, and when issues do arise, the mean time to recovery (MTTR) is significantly shortened. This increased predictability in project delivery and system stability is invaluable for business planning and risk management. For instance, knowing that a complex feature can be thoroughly debugged and optimized before release provides greater confidence in project timelines and budget forecasts, reducing the overall business risk associated with software deployments.
In essence, investing in developer tooling like React Developer Tools is an investment in the strategic capabilities of the entire organization. It’s about empowering the engineering team to be a true business driver, not just a cost center. By fostering an environment where developers can work efficiently, produce high-quality code, and deliver features rapidly, businesses can achieve their strategic objectives with greater certainty and sustain a competitive edge in the marketplace. The true cost of not providing such tools is far greater than any perceived expenditure, manifesting in slower innovation, lower quality, higher operational costs, and ultimately, missed business opportunities.
Choosing the Right Development Partner for React Projects
When an organization decides to invest in a sophisticated React application, whether it’s a custom web platform, a mobile app, or a SaaS product, the choice of a development partner is paramount. This decision directly impacts project outcomes, long-term maintainability, and the overall TCO. A partner proficient not only in React but also in leveraging tools like React Developer Tools ensures a higher standard of code quality, efficiency, and transparency throughout the development lifecycle.
Technical Expertise and Best Practices
A competent development partner will demonstrate deep expertise in React and its ecosystem. This includes not just writing functional code but also adhering to best practices in component architecture, state management, and performance optimization. They should be able to articulate how they use tools like React Developer Tools to ensure code quality, debug efficiently, and profile application performance. For example, during a project review, they should be able to walk through a component’s state or a performance profile, explaining their findings and proposed optimizations. This level of transparency indicates a mature and disciplined engineering approach.
Focus on Maintainability and Scalability
The long-term value of a software product is heavily tied to its maintainability and scalability. A good development partner prioritizes these aspects from the outset. This means structuring the codebase logically, writing clean and well-documented code, and using tools to prevent the accumulation of technical debt. When a partner consistently uses React Developer Tools to monitor component health, manage state complexity, and optimize rendering, they are actively contributing to the application’s future maintainability. This proactive stance significantly reduces future operational costs and facilitates easier feature expansion.
Transparent Communication and Reporting
Effective collaboration with a development partner relies on transparent communication. This includes regular updates on progress, challenges, and technical decisions. A partner who can effectively use tools like React Developer Tools to demonstrate application behavior, debug issues in real-time during joint sessions, or explain performance bottlenecks using concrete data from the Profiler fosters trust and clarity. This level of technical transparency ensures that stakeholders are well-informed and that potential issues are identified and addressed collaboratively, rather than emerging as surprises later in the project.
Understanding of Business Objectives
Beyond technical prowess, an ideal development partner understands the client’s business objectives. They don’t just build to specifications; they contribute strategic insights that align the technical solution with the broader business goals. When discussing performance, for example, they should be able to link specific optimizations identified by the React Profiler to tangible business benefits like improved conversion rates or reduced infrastructure costs. This business-centric approach ensures that the technical decisions made throughout the project lifecycle deliver maximum value.
Post-Launch Support and Knowledge Transfer
The engagement with a development partner often extends beyond the initial launch. Post-launch support, maintenance, and knowledge transfer to internal teams are crucial for the long-term success of the application. A partner who provides thorough documentation, conducts training sessions, and ensures that internal teams are proficient in using tools like React Developer Tools for ongoing maintenance empowers the client to manage the application effectively. This reduces reliance on external vendors in the long run and helps build internal capabilities, contributing to a lower TCO over the application’s lifespan.
Choosing a development partner, whether it’s a UK software development company or a team from elsewhere, requires a thorough evaluation of their technical depth, their approach to quality, and their ability to integrate advanced tooling into their processes. A partner who views React Developer Tools not just as a debugging utility but as a strategic enabler of efficiency and quality will undoubtedly deliver a superior product and a more valuable partnership.
Future Trends in React Development and Tooling Evolution
The landscape of web development, particularly within the React ecosystem, is in constant flux, driven by evolving user expectations and technological advancements. As a CTO, anticipating these changes and understanding the trajectory of tooling evolution is crucial for making informed strategic decisions that ensure the long-term viability and competitiveness of React applications. React Developer Tools, while already powerful, are expected to evolve in tandem with React itself, embracing new paradigms and addressing emerging challenges.
Server Components and Hydration Debugging
One of the most significant recent shifts in React is the introduction of Server Components. This paradigm allows developers to render components on the server, sending only the necessary HTML and serialized props to the client, which can dramatically improve initial page load performance. However, this introduces new complexities, particularly around hydration (the process of making server-rendered HTML interactive on the client) and the interaction between server-side and client-side components. Future iterations of React Developer Tools will undoubtedly need to provide enhanced visibility into this process, allowing developers to debug hydration mismatches, understand which components are rendered where, and analyze the performance implications of the server/client boundary. This will be critical for ensuring optimal performance and avoiding subtle bugs in hybrid rendering environments.
Improved AI-Assisted Debugging and Performance Analysis
The integration of AI and machine learning into development tools is an accelerating trend. While current React Developer Tools provide raw data, future versions might incorporate AI-powered insights. This could manifest as:
- Automated Performance Bottleneck Detection: AI could analyze profiling data and automatically suggest specific optimizations or common anti-patterns.
- Predictive Bug Identification: Based on code changes and runtime behavior, AI might flag potential bugs before they manifest, using patterns learned from large codebases.
- Contextual Debugging Suggestions: When a developer inspects a component, AI could provide context-aware suggestions for common issues or relevant documentation links.
Such features would further reduce the cognitive load on developers, allowing them to resolve issues more quickly and focus on higher-value tasks. For a CTO, this translates to even greater developer efficiency and a faster path to problem resolution, directly impacting project timelines and operational costs.
Enhanced Support for Concurrent React Features
React’s concurrent features, such as Suspense and Transitions, are designed to improve user experience by allowing React to prepare new UI in the background without blocking the main thread. Debugging applications that leverage these features can be challenging due to their asynchronous and interruptible nature. React Developer Tools will need to provide clearer visualizations and debugging capabilities for these concurrent modes, helping developers understand when and why components are suspending, how transitions are progressing, and how these features impact the overall rendering schedule. This will be essential for building smooth, responsive UIs that truly leverage React’s advanced capabilities.
Deeper Integration with IDEs and Cloud Environments
While the current tools are browser extensions, future trends might see deeper, more seamless integration with Integrated Development Environments (IDEs) and cloud-based development environments. Imagine debugging a remote application instance with the same fidelity as a local one, or having IDEs provide real-time component inspection alongside code editing. This would further unify the development experience, reducing context switching and enhancing productivity, especially for distributed teams or those working on complex cloud-native applications.
Staying abreast of these tooling evolutions is not just about adopting new features; it’s about strategically positioning the engineering team to leverage the most efficient development practices. By understanding where React and its ecosystem are heading, CTOs can ensure their teams remain productive, their applications remain performant, and their development processes stay ahead of the curve, securing a competitive advantage in the long term.
React Developer Tools are far more than a mere convenience; they are a foundational pillar for efficient, high-quality React development. Their capabilities in component inspection, state management, and performance profiling directly translate into tangible business benefits: increased team velocity, reduced technical debt, enhanced product quality, and a lower total cost of ownership. For any organization building with React, the proficient use of these tools is not optional; it is a strategic imperative that underpins the success of their digital initiatives.
As the React ecosystem continues to evolve, so too will its debugging and profiling tools. Staying current with these advancements and fostering a culture where developers are empowered to leverage such tools to their fullest potential will be critical for maintaining a competitive edge. By investing in robust developer tooling and practices, businesses can ensure their React applications are not only functional but also performant, maintainable, and scalable, delivering sustained value to their users and stakeholders.
We specialize in custom software development, including advanced React applications. If your team is struggling with performance bottlenecks, complex debugging scenarios, or simply wants to optimize your React development workflow, consider an expert review. We offer comprehensive code and architecture audits for your existing applications to identify areas for improvement and implement strategic solutions.
Explore our complete Laravel, Basics directory for more guides.
NR Studio builds custom web apps, mobile apps, SaaS platforms, and internal tools for growing businesses. If you’re working through a technical decision, feel free to reach out — no commitment required.