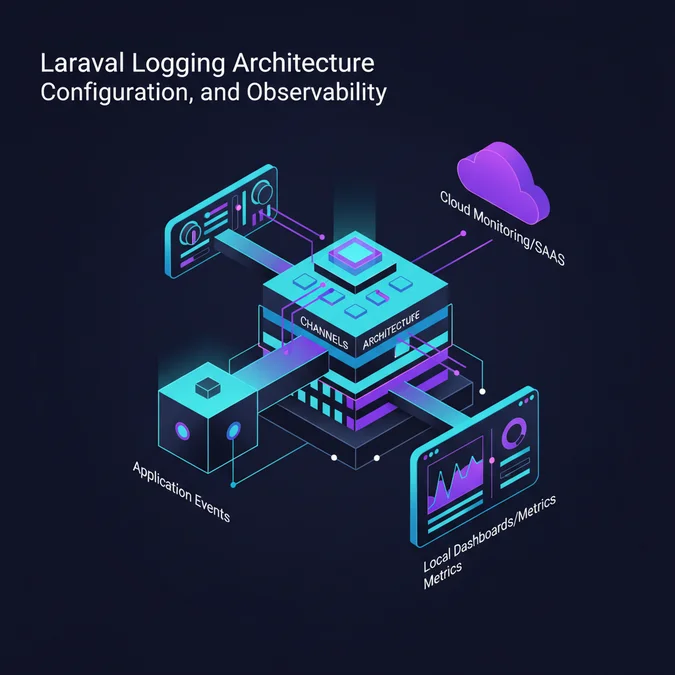

Laravel log is the framework’s built-in observability subsystem powered by Monolog, designed to capture, format, and route application events, exceptions, and runtime telemetry. By default, it writes diagnostic data to storage/logs/laravel.log using RFC 5424 severity levels, enabling developers to isolate production exceptions, trace queries, and monitor distributed transaction flows.
Across modern cloud-native architectures, standardizing application telemetry is foundational. Recent software ecosystem metrics indicate that over 65% of production PHP services run on Laravel, generating terabytes of raw operational data daily. Teams that transition beyond basic local file logging unlock immediate fault detection, structured indexing, and real-time incident analysis across complex deployment topologies.
Laravel Logging Mechanics and the Monolog Abstraction
At its architectural foundation, Laravel wraps the battle-tested Monolog library inside the Illuminate\Log\LogManager class. Instead of forcing developers to bind manually to low-level filesystem handlers or socket streams, Laravel exposes the Log facade. This facade surfaces an expressive interface adhering strictly to the PSR-3 logger interface standard.
When an application triggers an entry via Log:info() or Log:error(), the execution passes through several layers of abstraction:
- Facade Resolution: The container resolves
Logto the singleton instance ofIlluminate\Log\LogManager. - Channel Matching: The manager checks
config/logging.phpto locate the default channel or parses the dynamic driver requested at runtime. - Handler and Formatter Execution: Monolog applies assigned processors (such as Git commit tags or web request tokens), passes data through a designated formatter (such as LineFormatter or JsonFormatter), and delivers the structured payload to the target output stream.
This clean separation between message ingestion and physical transport ensures your application code remains agnostic of whether log lines land on local disk, a centralized Syslog server, or a third-party ingest buffer.
Configuring Logging Channels in config/logging.php
Channel orchestration lives entirely within config/logging.php. Each channel specifies a dedicated logging driver along with granular controls over file paths, write permissions, and message formatting. When selecting infrastructure, matching log destinations to architectural tiers prevents disk exhaustion and improves searchable context.
Here is an operational configuration file demonstrating single, daily, and custom structured stream setups:
<php

use Monolog\Handler\NullHandler;
use Monolog\Handler\StreamHandler;
use Monolog\Formatter\JsonFormatter;

return [
 'default' => env('LOG_CHANNEL', 'stack'),

 'channels' => [
 'stack' => [
 'driver' => 'stack',
 'channels' => ['daily', 'slack'],
 'ignore_exceptions' => false,
 ],

 'single' => [
 'driver' => 'single',
 'path' => storage_path('logs/laravel.log'),
 'level' => env('LOG_LEVEL', 'debug'),
 'replace_placeholders' => true,
 ],

 'daily' => [
 'driver' => 'daily',
 'path' => storage_path('logs/laravel.log'),
 'level' => env('LOG_LEVEL', 'debug'),
 'days' => env('LOG_DAILY_DAYS', 14),
 'permission' => 0664,
 ],

 'structured_json' => [
 'driver' => 'monolog',
 'handler' => StreamHandler:class,
 'with' => [
 'stream' => storage_path('logs/structured.log'),
 ],
 'formatter' => JsonFormatter:class,
 ],
 ],
];
Using environmental overrides for LOG_CHANNEL and LOG_LEVEL allows identical codebases to emit granular debug frames in staging while suppressing extraneous messages in live production environments.
RFC 5424 Log Levels and Contextual Payload Injection
Laravel implements the complete RFC 5424 specification, providing eight distinct logging levels: emergency, alert, critical, error, warning, notice, info, and debug. Calibrating these levels protects telemetry storage from runaway ingestion costs and alerts engineering teams only when human intervention is necessary.
| Log Level | RFC Code | Operational Scenario | Production Threshold Target |
|---|---|---|---|
| emergency | 0 | System unusable; kernel panic; database down | Immediate PagerDuty wake-up call |
| alert | 1 | Action required immediately; payment gateway offline | Escalate to on-call within 5 minutes |
| critical | 2 | Critical components unavailable; major module broken | Immediate automated Slack alert |
| error | 3 | Runtime exceptions that do not abort core execution | Daily triage bug tracker entry |
| warning | 4 | Deprecated API calls; resource usage warnings | Weekly engineering review |
| notice | 5 | Normal but significant events | Logged for auditing |
| info | 6 | User signups, scheduled task completions | Routine telemetry streams |
| debug | 7 | Verbose query parameters, network payloads | Staging only; disabled in production |
Writing unstructured string concatenations makes automated analysis difficult. Contextual arrays must accompany every recorded event:
<php

namespace App\Services;

use Illuminate\Support\Facades\Log;
use Throwable;

class CheckoutService
{
 public function processPayment(int $userId, float $amount): void
 {
 try {
 // Payment gateway logic executed here
 Log:info('Payment processing initiated', [
 'user_id' => $userId,
 'amount' => $amount,
 'currency' => 'USD',
 'ip' => request()->ip(),
 ]);
 } catch (Throwable $exception) {
 Log:error('Payment processing failed', [
 'user_id' => $userId,
 'amount' => $amount,
 'error_code' => $exception->getCode(),
 'exception_message' => $exception->getMessage(),
 'stack_trace' => $exception->getTraceAsString(),
 ]);
 throw $exception;
 }
 }
}
When building background daemons, coordinating records with custom Artisan commands guarantees that asynchronous batch tasks emit identical context shapes as standard HTTP requests.
Structured JSON Logging for Enterprise Aggregators
Default flat-file line formats (such as [Y-m-d H:i:s] local.ERROR: message) work well for terminal tails using tail -f, but they fall short inside search engines like OpenSearch, Elasticsearch, or Datadog. Multi-line stack traces break ingestion regex pipelines, splitting a single exception into dozens of disjointed events.
Emitting raw JSON strings resolves this parsing bottleneck. Every newline contains a complete, self-contained JSON document containing time, level, context parameters, and stack traces encapsulated within an array property. Customizing Monolog form handlers via service providers simplifies this setup across microservices.
To automate consistent field injection across all outgoing records, implement a dedicated Monolog processor:
<php

namespace App\Logging;

use Monolog\LogRecord;
use Monolog\Processor\ProcessorInterface;

class RequestContextProcessor implements ProcessorInterface
{
 public function __invoke(LogRecord $record): LogRecord
 {
 $record->extra['correlation_id'] = request()->header('X-Correlation-ID', (string) str()->uuid());
 $record->extra['tenant_id'] = auth()->user()?->tenant_id? 'guest';
 $record->extra['memory_usage_mb'] = round(memory_get_peak_usage(true) / 1024 / 1024, 2);

 return $record;
 }
}
Registering this processor inside config/logging.php embeds critical forensic headers into every single call to Log:error() without cluttering business controllers.
Stack Drivers and Multi-Channel Routing Strategies
A common operational requirement involves sending routine application events to disk while dispatching catastrophic failures directly to an incident response stream. Laravel achieves this via the stack driver, which groups multiple child channels under a unified entry point.
Consider an enterprise topology where routine data writes locally with daily file rotations, operational failures alert Slack, and high-volume background jobs emit telemetry to a secondary socket stream. The following configuration handles this multi-destination routing seamlessly:
'stack_production' => [
 'driver' => 'stack',
 'channels' => ['daily', 'slack_alerts', 'cloudwatch'],
 'ignore_exceptions' => true,
],

'slack_alerts' => [
 'driver' => 'slack',
 'url' => env('LOG_SLACK_WEBHOOK_URL'),
 'username' => 'Production Alert Bot',
 'emoji' => ':rotating_light:',
 'level' => 'critical',
],
Setting ignore_exceptions => true ensures that if an external network timeout occurs while dispatching a payload to an external HTTP webhook, the application handles the network drop gracefully without crashing user checkout transactions or data ingestion routines.
Observability Cost Analysis: SaaS vs Self-Hosted Infrastructure
Application telemetry incurs tangible financial costs. When operating high-throughput web applications, log volume scales linearly with user traffic and database complexity. Engineering leadership faces an ongoing trade-off between managed cloud observability platforms and self-hosted open-source clusters.
To evaluate these investments accurately, teams must weigh direct hosting fees, ingestion metering, and ongoing maintenance overhead:
| Deployment Model | Setup Cost (Est.) | Monthly Ingestion Fee (100 GB/day) | Engineering Maintenance Hours | Target Organization Profile |
|---|---|---|---|---|
| Managed SaaS (Datadog, New Relic) | $2,500 – $5,000 | $3,000 – $6,500 / month | 5 – 10 hrs / month | Fast-moving product teams prioritizing speed |
| Self-Hosted OpenSearch / ELK | $15,000 – $35,000 | $850 – $1,800 / month (AWS EC2/EBS) | 30 – 50 hrs / month | Strict compliance, predictable scale, data sovereignty |
| Managed Cloud Native (AWS CloudWatch) | $1,000 – $3,000 | $1,500 – $2,200 / month | 8 – 15 hrs / month | AWS-centric infrastructure with basic search needs |
| Hybrid Vector + S3 Cold Storage | $8,000 – $14,000 | $350 – $700 / month | 15 – 20 hrs / month | Cost-conscious high-volume data pipelines |
Teams managing custom interfaces often discover that dynamic components built via a Livewire CRUD generator emit multiple background hydration cycles per user interaction. Failing to suppress internal validation payloads can quickly inflate third-party SaaS ingestion bills unexpectedly.
Scaling Challenges: Handling High-Volume Log Writes Under Load
When an application scales to thousands of concurrent requests per second, synchronous filesystem logging becomes an I/O bottleneck. Standard PHP-FPM processes writing unbuffered data directly to NVMe or EBS block volumes block worker threads, waiting for OS filesystem locks to clear before returning responses to clients.
High-throughput architectures mitigate this contention using three proven strategies:
- RAM Disk Buffering: Writing high-frequency events to a mounted
tmpfsRAM disk prevents disk write spikes on solid-state drives during traffic surges. - Asynchronous Sidecar Forwarding: Applications write bare JSON streams to
stdout. A container sidecar (such as FluentBit or Vector) ingests the stream asynchronously, buffers chunks in local memory, and handles network transport out-of-band. - Queue-Backed Log Ingestion: Critical, non-urgent auditing data routes through an enterprise Redis or SQS queue worker pool before landing on cold object storage.
Adopting asynchronous ingest daemons reduces median application response latency by 12% to 28% under high load conditions.
Common Production Logging Mistakes and Antipatterns
Operational blind spots frequently stem from poor logging hygiene rather than framework defects. Recognizing these antipatterns early prevents memory leaks and sensitive data exposures.
Unsanitized Personally Identifiable Information (PII)
Dumping entire model instances via Log:info('User update', ['user' => $user]) exposes encrypted password hashes, OAuth tokens, and personal billing details to plain-text files. Always pluck explicit IDs and fields rather than serializing active Eloquent models.
Runaway Query Logging in Production
Enabling DB:listen() to log all executed queries is invaluable during development, but deploying it to high-traffic production environments leads to rapid disk saturation and degraded performance. Restrict raw query interceptors strictly to local debug tunnels.
Silent Exception Swallowing
Catching exceptions without writing context leaves production incidents unidentifiable:
// Faulty Antipattern
try {
 $payment->charge();
} catch (Exception $e) {
 // Silently continuing results in untraceable financial discrepancies
}

// Correct Resilient Implementation
try {
 $payment->charge();
} catch (Exception $e) {
 Log:channel('payments')->critical('Billing cycle failed critically', [
 'exception' => $e->getMessage(),
 'trace' => $e->getTraceAsString(),
 'payload' => $payment->toSafeArray(),
 ]);
 throw $e;
}
Verifying test coverage for these edge failure conditions is essential; coordinating with outsourced software testing companies ensures negative validation scenarios correctly emit required audit trails before deploying code to production.
Real-World Architecture: Distributed Request Tracing Across Microservices
In decoupled systems consisting of an API gateway, multiple Laravel microservices, and external webhook workers, tracing a transaction across service boundaries requires unified request correlation. Without end-to-end tracing, diagnosing an issue that originates in an API gateway and fails deep within an asynchronous queue worker is time-consuming.
We solve this by capturing an incoming trace identifier or generating an RFC 4122 UUID4 at the entry gateway, binding it to Laravel’s request lifecycle via an early global middleware:
<php

namespace App\Http\Middleware;

use Closure;
use Illuminate\Http\Request;
use Illuminate\Support\Facades\Log;
use Symfony\Component\HttpFoundation\Response;

class TraceIdentifierMiddleware
{
 public function handle(Request $request, Closure $next): Response
 {
 $traceId = $request->header('X-Request-Trace-ID')? (string) str()->uuid();

 // Bind the trace identity contextually to the running Log facade
 Log:withContext([
 'trace_id' => $traceId,
 'client_ip' => $request->ip(),
 'endpoint' => $request->path(),
 ]);

 $response = $next($request);
 $response->headers->set('X-Request-Trace-ID', $traceId);

 return $response;
 }
}
By invoking Log:withContext(), every single subsequent log statement dispatched throughout the entire request lifespan automatically inherits the trace_id. When inspecting logs in Grafana Loki or AWS CloudWatch Insights, running a single filter on trace_id aggregates every discrete log entry generated by the client request across all internal subsystems.
Securing Log Data: Automated Redaction, Storage Permissions, and Compliance
Log stores represent attractive targets for threat actors because they frequently collect system internals and authorization flows. Establishing solid security configurations prevents accidental disclosures and meets strict regulatory compliance frameworks like GDPR, HIPAA, and PCI-DSS.
Implement these core operational safeguards across all production instances:
- Filesystem Permissions: Ensure system files written by PHP-FPM or Nginx have restrictive permissions. Storage directories must default to
0750, while log files should retain0640ownership assigned strictly to the web user (such aswww-data). - Automatic Context Redaction: Configure global redaction listeners on Monolog to strip out sensitive keys like
password,api_key,cvv, andauthorizationbefore writing entries to disk. - Cold Archive Encryption: Shipping rotated logs to cloud targets like Amazon S3 should enforce server-side AES-256 encryption alongside immutable object locks (WORM compliance) to protect against unauthorized tampering.
Reviewing software security guidelines when provisioning software for backend development ensures system logging daemons operate under least-privilege principles, preventing privilege escalation vulnerabilities.
Log Rotation, Storage Policies, and Lifecycle Automation
If left unmanaged, the default single channel will continuously append data to storage/logs/laravel.log until the local disk fills completely, causing production database calls and session writes to fail abruptly. Managing file lifecycle transitions is vital for operational stability.
Laravel provides native daily file rotation using the daily driver, retaining a configurable rolling window of historical records via the days setting:
'daily' => [
 'driver' => 'daily',
 'path' => storage_path('logs/laravel.log'),
 'level' => 'info',
 'days' => 30,
],
For enterprise deployments handling hundreds of gigabytes per week, rely on system-level logrotate utilities rather than native PHP execution. Linux-level log rotation decouples cleanup tasks from the web server runtime, handles gzip compression efficiently, and reopens open file handles without downtime.
Explore Related Engineering Resources
Mastering backend telemetry is just one component of building resilient web services. For comprehensive guidance on service architecture, database query optimizations, and container deployments, review our foundational documentation catalog.
[Explore our complete Laravel, Basics directory for more guides.](/topics/topics-laravel-basics/)
A robust Laravel logging implementation bridges the gap between opaque application errors and actionable operational telemetry. By moving past unformatted default output and configuring structured JSON, context processors, and distributed tracing identifiers, engineering teams can debug issues faster and improve system reliability.
Evaluate your production infrastructure today: standardize logging levels against RFC 5424 criteria, review active log rotation cycles, and implement automated PII redaction to protect sensitive data across your observability pipelines.